This is an archive post of content I wrote for the NTDebugging Blog on MSDN. Since the MSDN blogs are being retired, I’m transferring my posts here so they aren’t lost. The post has been back-dated to its original publication date.
Last time, we discussed how applications place data on the clipboard, and how to access that data using the debugger. Today, we’ll take a look at how an application can monitor the clipboard for changes. Understanding this is important, because it is a place where Windows allows 3rd-party code to “hook” into the system – so if you experience unexpected behavior with copying and pasting, a program using these hooks may be misbehaving. We’ll start by covering the hooking mechanisms for clipboard, and then review how to identify what applications, if any, are using these hooks in the debugger.
There are three ways to monitor the clipboard for changes – clipboard viewers, clipboard format listeners, and querying the clipboard sequence number. We will focus on the first two as these allow an application to register for notifications whenever the clipboard is updated. The third method simply allows an application to check and see if a change has occurred, and should not be used in a polling loop.
The Clipboard Viewer functionality has been around since Windows 2000, if not earlier. The way it works is pretty simple – an application interested in receiving clipboard change notifications calls SetClipboardViewer and passes a handle to its window. Windows then stores that handle in a per-session win32k global, and anytime the clipboard changed, windows sends a WM_DRAWCLIPBOARD message to the registered window.
Of course, multiple applications are allowed to register their windows as clipboard viewers – so how does Windows handle that? Well, if an application calls SetClipboardViewer and another clipboard viewer was already registered, Windows returns the handle value of the previous viewer’s window to the new viewer. It is then the responsibility of the new viewer to call SendMessage every time it receives a WM_DRAWCLIPBOARD to notify the next viewer in the chain. Each clipboard viewer also needs to handle the WM_CHANGECBCHAIN message, which notifies the viewers when one of the viewers in the chain was removed and specifies what the next viewer in the chain is. This allows the chain to be maintained.
An obvious problem with this design is it relies on each clipboard viewer application to behave correctly, not to terminate unexpectedly, and to generally be a good citizen. If any viewer decided not to be friendly, it could simply skip notifying the new viewer in line about an update, rendering that and all subsequent viewers impotent.
To address these problems, the Clipboard Format Listener mechanism was added in Windows Vista. This works in much the same way as the clipboard viewer functionality except in this case, Windows maintains the list of listeners, instead of depending on each application to preserve a chain.
If an application wishes to become a clipboard format listener, it calls the AddClipboardFormatListener function and passes in a handle to its window. After that, its window message handler will receive WM_CLIPBOARDUPDATE messages. When the application is ready to exit or no longer wishes to receive notifications, it can call RemoveClipboardFormatListener.
Now that we’ve covered the ways to register a viewer/listener, let’s take a look at how to identify them using the debugger. First, you’ll need to identify a process in the session you are interested in checking for clipboard monitors. It can be any win32 process in that session – we just need to use it to locate a pointer to the Window Station. In this case, I’ll use the Notepad window I used in part 1:
If you are doing this in a live kernel debug, you’ll need to change context into the process interactively (using .process /I <address> then hit g and wait for the debugger to break back in). Now DT the process address as an _EPROCESS and look for the Win32Process field:
Note the spwndClipViewer, spwndClipboardListener, and spwndClipOwner fields. spwndClipViewer is the most-recently-registered window in the clipboard viewer chain. Similarly, spwndClipboardListener is the most recent listener in our Clipboard Format Listener list. spwndClipOwner is the window that set the content in the clipboard.
Given the window, it is just a few steps to determine the process. This would work for spwndClipViewer, spwndClipboardListener, and spwndClipOwner. First, dt the value as a tagWND. We’ll use the spwndClipViewer for this demonstration:
As you can see, we have a clipboard viewer registered from process viewer02.exe. Because of viewer’s process-maintained chain architecture, it isn’t easy to see the next process in the chain. However, we can do this for clipboard listeners. Let’s look back at our window station:
Using this window address, we can go through the same steps as above to identify this listener’s process name. As mentioned earlier, since tagWND is a kernel structure, the OS is maintaining these spwndClipboardListener/spwndClipboardListenerNext pointers, so they aren’t susceptible to the chain problems of clipboard viewers.
That wraps up our clipboard coverage. I hope you found it informative. Want to learn more about monitoring the clipboard? This MSDN article is a good resource.
This is an archive post of content I wrote for the NTDebugging Blog on MSDN. Since the MSDN blogs are being retired, I’m transferring my posts here so they aren’t lost. The post has been back-dated to its original publication date.
Recently, I had the opportunity to debug the clipboard in Windows, and I thought I’d share some of the things I learned. The clipboard is one of those parts of Windows that many of us use dozens (hundreds?) of times a day and don’t really think about. Before working on this case, I had never even considered how it works under the hood. It turns out that there’s more to it than you might think. In this first article, I’ll describe how applications store different types of data to the clipboard and how it is retrieved. My next post will describe how applications can hook the clipboard to monitor it for changes. In both, I’ll include debug notes to show you how to access the data from the debugger.
Let’s start by discussing clipboard formats. A clipboard format is used to describe what type of data is placed on the clipboard. There are a number of predefined standard formats that an application can use, such as bitmap, ANSI text, Unicode text, and TIFF. Windows also allows an application to specify its own formats. For example, a word processor may want to register a format that includes text, formatting, and images. Of course – this leads to one problem – what happens if you want to copy from your word processor and paste into Notepad, which doesn’t understand all of the formatting and pictures?
The answer is to allow multiple formats to be stored in the clipboard at one time. When I used to think of the clipboard, I thought of it as a single object (“my text” or “my image”) but in reality, the clipboard usually has my data in several different forms so when I paste, the destination program gets a format it can use.
So how does this data end up on the clipboard? Simple – an application first takes ownership of the clipboard via the OpenClipboard function. Once it has done that, it can empty the clipboard with EmptyClipboard. Finally, it is ready to place data on the clipboard using SetClipboardData. SetClipboardData takes two parameters – the first is the identifier of one of the clipboard formats we discussed above. The second is a handle to the memory containing the data in that format. The application can continue to call SetClipboardData for each of the various formats it wishes to provide going from best to worst (since the destination application will select the first format in the list it recognizes). To make things easier for the developer, Windows will automatically provide converted formats for some clipboard format types. Once the program is done, it calls CloseClipboard.
When a user hits paste, the destination application will call OpenClipboard and one of these functions to determine what data format(s) are available: IsClipboardFormatAvailable, GetPriorityClipboardFormat, or EnumClipboardFormats. Assuming the application finds a format it can use, it will then call GetClipboardData with the desired format identifier as a parameter to get a handle to the data. Finally, it will call CloseClipboard.
Now let’s take a look at how you can find what data being written to the clipboard using the debugger. (Note that all of my notes are taken from a Win7/2008 R2 system – so things might vary slightly in different versions of the OS.) Since the clipboard is part of Win32k.sys, you’ll need to use a kernel debugger. I like to use win32k!InternalSetClipboardData+0xe4 as a breakpoint. The nice thing about this offset is that it is right after we’ve populated the RDI register with data from SetClipboardData in a structure known as tagCLIP.
Fmt is the clipboard format. 0xd is 13, which indicates this data is Unicode text. We can’t just ‘du’ the value in hData, however, because this is a handle, not a direct pointer to the data. So now we need to look up the handle. To do that, we need to look at a win32k global structure – gSharedInfo:
aheList in gSharedInfo contains an array of handle entries, and the last 2 bytes of hData multiplied by the size of a handle entry the address of our handle entry:
If we look in phead at offset 14, we’ll get our data:
kd> du fffff900`c0de0fb0 + 0x14
fffff900`c0de0fc4  "Hi NTDebugging readers!"
Let’s consider one other scenario. I copied some text out of Wordpad, and a number of SetClipboardData calls were made to accommodate different formats. The Unicode format entry looks like this:
hData is null! Why is that? It turns out that the clipboard allows an application to pass in null to SetClipboardData for a given format. This indicates that the application can provide the data in that format, but is deferring doing so until it is actually needed. Sure enough, if I paste the text into Notepad, which needs the text in Unicode, Windows sends a WM_RENDERFORMAT message to the WordPad window, and WordPad provides the data in the new format. Of course, if the application exits before populating all of its formats, Windows needs all of the formats rendered. In this case, Windows will send the WM_RENDERALLFORMATS message so other applications can use the clipboard data after the source application has exited.
That’s all for now. Next time we’ll look at how applications can monitor the clipboard for changes using two hooks. If you want to know more about using the clipboard in your code, this is a great reference.
This is an archive post of content I wrote for the NTDebugging Blog on MSDN. Since the MSDN blogs are being retired, I’m transferring my posts here so they aren’t lost. The post has been back-dated to its original publication date.
Matt Burrough here again. On rare occasions when debugging, we’ll actually know (or strongly suspect) what the root cause of a problem is at the beginning of our analysis – but we still need to investigate to confirm our assertion. The following is a case study for an issue I worked on recently where the print spooler was hanging.
This customer had recently upgraded their print servers from Windows 2003 to Windows 2008 R2. After the upgrade, the spooler would frequently go unresponsive, and no jobs could be printed. Rebooting the server provided some relief, but the problem would reoccur as the jobs started coming in again.
One of my peers had completed an initial analysis of a user mode memory dump of the spooler process, and found that spooler seemed to be blocked waiting on PrintIsolationHost.exe. For those not familiar with recent changes to the print spooler’s design – Print Isolation Host was added in Windows 7/2008 R2 as a way to isolate print drivers from each other and from the spooler process so a crash in one driver doesn’t take down the entire printing environment. Given the large number of print drivers found on some print servers, this can be a great help for stability and availability of the spooler. See http://blogs.technet.com/b/askperf/archive/2009/10/08/windows-7-windows-server-2008-r2-print-driver-isolation.aspx if you would like more details on Print Isolation Host.
Unfortunately for my team mate, the data collected did not include dumps of Print Isolation Host, so he requested that the next time the problem happened that both spooler and PrintIsolationHost dumps would be gathered. The customer had configured his server for the “Isolated” Print Isolation Host option during troubleshooting, which places each driver in its own process. (The default is shared which places all drivers in one PrintIsolationHost.exe instance. Driver isolation is configured using the Print Management Console.)
The next morning, the newly requested data came in, and since the problem was urgent, I began looking at the new dumps immediately. This dataset included both a spoolsv.exe dump, as well as nearly two dozen PrintIsolationHost dumps! I knew from the past analysis that I should start with the PrintIsolationHost data – but where to begin? In order to triage the dumps, I wrote a small batch file to open each dump (luckily, they were sequentially numbered), write the call stacks in each thread to a file, and close the log. On every iteration, the script created a new cmd.txt file, which contained a set of commands that were passed to the debugger. This allowed me to name the debugger output files sequentially with names that matched their dump (e.g. PrintIsolationHost1.txt contained output from PrintIsolationHost1.dmp).
set x=1
:Top
echo .reload > c:\data\cmd.txt
echo .logopen c:\data\PrintIsolationHost%x%.txt  >> c:\data\cmd.txt
echo ~*kc >> c:\data\cmd.txt
echo .logclose >> c:\data\cmd.txt
echo qq >> c:\data\cmd.txt
c:\debuggers\kd.exe -cf c:\data\cmd.txt -z "c:\data\PrintIsolationHost%x%.DMP"
set /A x+=1
IF %x% LEQ 23 GOTO Top
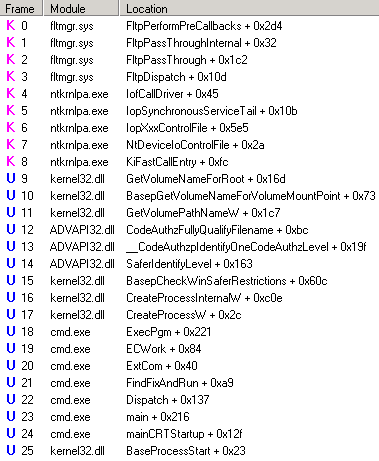
Now that I had a directory full of text files, I used my favorite differencing tool to compare the stacks in each text file. I used the first PrintIsolationHost file as a reference. It only had four stacks, and these were common to all of the other files:
I was able to rule out a number of other PrintIsolationHost instances that were either identical to this one (aside from the process/thread IDs and Tebs), or which just had one or two additional idle worker threads (like thread 3 above).
Things got interesting when I looked at two of the PrintIsolationHost dumps. Both had these two stacks not found in any other the other dumps (note that I do not have symbols for the 3rd-party print processor ProseWarePrintProcessor):
   2  Id: 20a4.1328 Suspend: 0 Teb: 000007ff`fffda000 Unfrozen
Call Site
ntdll!ZwWaitForSingleObject
ntdll!RtlpWaitOnCriticalSection
ntdll!RtlEnterCriticalSection
ntdll!LdrLockLoaderLock
*** ERROR: Symbol file could not be found.  Defaulted to export symbols for ProseWarePrintProcessor.dll -
KERNELBASE!GetModuleFileNameW
ProseWarePrintProcessor
ProseWarePrintProcessor
ProseWarePrintProcessor!ControlPrintProcessor
PrintIsolationProxy!sandbox::PrintProcessor::ControlPrintProcessor
rpcrt4!Invoke
rpcrt4!Ndr64StubWorker
rpcrt4!NdrStubCall3
ole32!CStdStubBuffer_Invoke
ole32!SyncStubInvoke
ole32!StubInvoke
ole32!CCtxComChnl::ContextInvoke
ole32!AppInvoke
ole32!ComInvokeWithLockAndIPID
ole32!ThreadInvoke
rpcrt4!DispatchToStubInCNoAvrf
rpcrt4!RPC_INTERFACE::DispatchToStubWorker
rpcrt4!RPC_INTERFACE::DispatchToStub
rpcrt4!RPC_INTERFACE::DispatchToStubWithObject
rpcrt4!LRPC_SCALL::DispatchRequest
rpcrt4!LRPC_SCALL::HandleRequest
rpcrt4!LRPC_ADDRESS::ProcessIO
rpcrt4!LrpcIoComplete
ntdll!TppAlpcpExecuteCallback
ntdll!TppWorkerThread
kernel32!BaseThreadInitThunk
ntdll!RtlUserThreadStart

   6  Id: 20a4.1668 Suspend: 0 Teb: 000007ff`fffac000 Unfrozen
Call Site
ntdll!ZwWaitForSingleObject
ntdll!RtlpWaitOnCriticalSection
ntdll!RtlEnterCriticalSection
ProseWarePrintProcessor
ProseWarePrintProcessor
ProseWarePrintProcessor
ntdll!LdrpInitializeThread
ntdll!_LdrpInitialize
ntdll!LdrInitializeThunk
Interesting. Thread 6 is running the DllMain code for the ProseWarePrintProcessor DLL which holds the loader lock. It is waiting on a critical section. Meanwhile, thread 2 is waiting on the loader lock. So who holds the critical section that thread 6 wants? First, let’s find what lock thread 6 wants:
0:006> kn
# Child-SP RetAddr Call Site
00 00000000`0104eb18 00000000`777fe4e8 ntdll!ZwWaitForSingleObject+0xa
01 00000000`0104eb20 00000000`777fe3db ntdll!RtlpWaitOnCriticalSection+0xe8
02 00000000`0104ebd0 00000000`750c5d6b ntdll!RtlEnterCriticalSection+0xd1
03 00000000`0104ec00 00000000`750c6256 ProseWarePrintProcessor+0xabf
04 00000000`0104ec30 00000000`750c7015 ProseWarePrintProcessor+0xfaa
05 00000000`0104f090 00000000`777dc76c ProseWarePrintProcessor+0x1d69
06 00000000`0104f1f0 00000000`777dc42f ntdll!LdrpInitializeThread+0x17c
07 00000000`0104f2f0 00000000`777dc32e ntdll!LdrpInitialize+0x9f
08 00000000`0104f360 00000000`00000000 ntdll!LdrInitializeThunk+0xe
0:006> .frame /c /r 2
02 00000000`0104ebd0 00000000`750c5d6b ntdll!RtlEnterCriticalSection+0xd1
rax=0000000300d1001a rbx=00000000750ca330 rcx=00000000001d0000
rdx=0000000000000040 rsi=0000000000000001 rdi=0000000000000004
rip=00000000777fe3db rsp=000000000104ebd0 rbp=00000000ff000000
r8=00000000002c6a00 r9=00000000002c6a10 r10=0000000000000073
r11=0000000000000001 r12=000007fffffd6000 r13=00000000778e2660
r14=0000000000000001 r15=000000007780a280
iopl=0 nv up ei pl zr na po nc
cs=0033 ss=002b ds=002b es=002b fs=0053 gs=002b efl=00000246
ntdll!RtlEnterCriticalSection+0xd1:
00000000`777fe3db 83f801 cmp eax,1
0:006> ub 00000000`750c5d6b <----------- Let's see what gets passed to RtlEnterCriticalSection
ProseWarePrintProcessor+0xaa2:
00000000`750c5d4e f9 stc
00000000`750c5d4f ff743f33 push qword ptr [rdi+rdi+33h]
00000000`750c5d53 d2ff sar bh,cl
00000000`750c5d55 15aeb4ffff adc eax,0FFFFB4AEh
00000000`750c5d5a 85c0 test eax,eax
00000000`750c5d5c 7533 jne ProseWarePrintProcessor+0xae5 (00000000`750c5d91)
00000000`750c5d5e 488d0dcb450000 lea rcx,[ProseWarePrintProcessor+0x5084 (00000000`750ca330)] <----- Critical section is in rcx
00000000`750c5d65 ff15bdb3ffff call qword ptr [ProseWarePrintProcessor+0x1128 (00000000`750c1128)]
0:006> u ntdll!RtlEnterCriticalSection
ntdll!RtlEnterCriticalSection:
00000000`77802fc0 fff3 push rbx
00000000`77802fc2 4883ec20 sub rsp,20h
00000000`77802fc6 f00fba710800 lock btr dword ptr [rcx+8],0
00000000`77802fcc 488bd9 mov rbx,rcx <------------------ Critical section is saved in RBX. RBX isn't modified between here and our current position
00000000`77802fcf 0f83e9b1ffff jae ntdll!RtlEnterCriticalSection+0x31 (00000000`777fe1be)
00000000`77802fd5 65488b042530000000 mov rax,qword ptr gs:[30h]
00000000`77802fde 488b4848 mov rcx,qword ptr [rax+48h]
00000000`77802fe2 c7430c01000000 mov dword ptr [rbx+0Ch],1
0:006> r rbx
Last set context:
rbx=00000000750ca330<----- This is the address of the critical section thread 6 is waiting for
Now let’s look at the threads in this process, and the held locks:
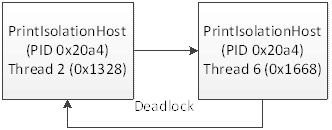
That’s not good! We can see that thread 6 indeed owns the loader lock, which thread 2 is waiting for. But thread 2 owns the ProseWarePrintProcessor lock – and thread 6 is waiting for it! This is a classic deadlock. In fact, Raymond Chen even described this on his blog. More information about LdrInitialize can be found here.
Deadlock chain
So we know that there is a deadlock in the Print Isolation Host, but why exactly does this cause spooler to hang? Here’s where we work backwards. We know that thread 6 is handling DLL initialization, but what is thread 2 doing? From the stack we can see it is handling an RPC request that called into ProseWarePrintProcessor. Let’s determine who called into this thread.
I know that the code in frame 19 deals with processing the RPC and has a record of the calling process’ PID and TID. In fact, from a bit of code review, I know that at this portion of the code, we get back a value that contains a ntdll!_CLIENT_ID structure at offset 8:
Reviewing the assembly, from ProcessIO+0xe6 to where we are now (ProcessIO+0x3bf), we don’t modify rdi again – and rdi is nonvolatile – so if we switch to that frame and check out rdi+8, we’ll know who called this thread!
So now we know that the caller was process 0x2694 and thread 0x5e8, or 9876 and 1512 in decimal, respectively. Our current process (PrintIsolationHost.exe) is PID 20a4 (see above ~ output), or 8356 decimal. So who is 9876? I happen to have a Process Listing from the dump of the data collection:
It’s calling into the print isolation host as we expect. It looks like it is doing that to end a print job, based on an RPC call it received. Using our same method as last time, let’s pull out the PID and TID he is responding to:
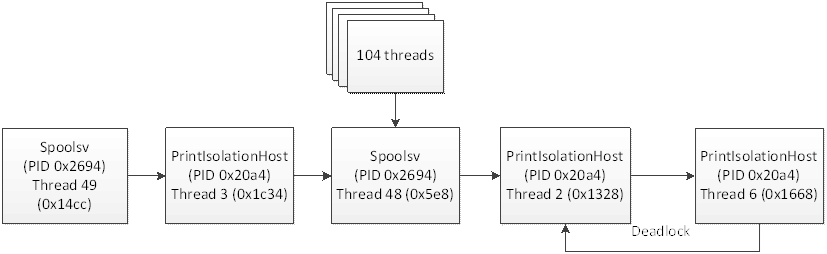
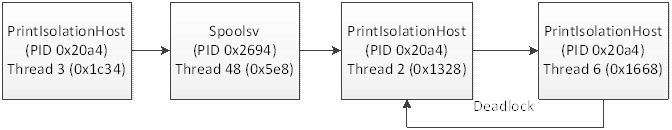
Perfect. So now we know that localspl was printing a document, which resulted in all of these RPC calls between spooler and Print Isolation Host, and ultimately the deadlock in Print Isolation Host is holding up this thread. Just out of curiosity, are there any other threads blocked on this wait chain?
Yes there are. Thread 5e8, which we looked at earlier, is holding a lock that 104 other threads are waiting for! This dump had 177 threads, so we know now that thread 5e8, 14cc, and 104 others in spooler are all hung on this deadlock. With about 60% of all the threads in spooler hung, the deadlock in ProseWarePrintProcessor is clearly the cause of our issue. Here’s the final wait chain diagram:
Waiters
To resolve the issue, ProseWarePrintProcessor needs to avoid calling GetModuleFileName while its DllMain routine is still running, since the former requires, and the latter holds, the Loader Lock.
This is an archive post of content I wrote for the NTDebugging Blog on MSDN. Since the MSDN blogs are being retired, I’m transferring my posts here so they aren’t lost. The post has been back-dated to its original publication date.
Hi all, Matt here again. One of our team’s main functions is to work with our development teams to create hotfixes when customers run into issues that can only be resolved through a code change. The developers will often prepare a private hotfix that either tests the proposed change, or adds additional instrumentation to help pinpoint the issue. The private hotfix is sent to the customer reporting the problem so they can confirm that it does indeed correct (or identify) the flaw.
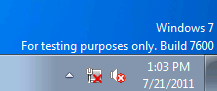
When testing a private hotfix, customers frequently ask, why does my desktop now show a message on the lower right corner of the desktop, and what does it mean? The message reads “For testing purposes only”, and looks like this:
For testing purposes only Watermark
Often, users are concerned that his message means that they aren’t allowed to use the server in production, or maybe that it is now “unsupported.” These aren’t the case! Since this message appears as a result of installing a fix during the course of a Microsoft Support case, the servers are, by definition, being supported.
The purpose of this message is simply to remind users that code that Microsoft Support has asked them to test has been installed on the system, and this code may not have yet undergone the full suite of quality assurance testing that fixes that are made public do.
For comparison, let’s look at some of the other watermarks you may find in the lower corner of the desktop – as these can often be confused for the above message, and may explain some of the fears around these messages.
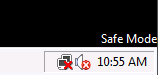
Safe Mode Watermark
First up is the old trusty text you see when a box is booted into ‘Safe Mode’. I’m sure every IT Pro has seen this at one time or another, so I won’t go into detail, but rest assured, the testing purposes text is completely unrelated to booting in safe mode or having a subset of services running.
Evaluation copy Watermark
Next up is our ‘Evaluation copy’ watermark. This message is shown on the desktops of copies of Windows that have a “time bomb” (ones that will cease to function after a certain date.) This message is typically seen on beta versions of Windows which are designed to stop functioning sometime after the desired beta testing period ends.
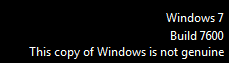
This copy of Windows is not genuine Watermark
Third, we have our Windows is not genuine message. This is shown if, for example, a copy of Windows is not activated during the grace period after the installation process, or if a number of hardware changes have been made and Windows needs to be re-activated. This has nothing to do with the ‘testing purposes’ message. See http://technet.microsoft.com/en-us/library/dd979803.aspx for more information about this message.
Build Number Watermark
Fourth, we have the general Windows build stamp. This is enabled via the registry using the PaintDesktopVersion DWORD (http://technet.microsoft.com/en-us/library/cc782257(WS.10).aspx). Some administrators like to enable this option so they always know what version of Windows they are using, sort of like a mini-bginfo. Unlike all of the others, this message does not indicate anything else about a server’s state.
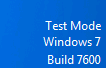
Test Mode Watermark
And finally, we have ‘Test Mode’. This is actually somewhat related to the testing purposes message. This ‘Test Mode’ text is shown when test signing is enabled on a PC. This is done by running “bcdedit /set testsigning on” from an UAC-elevated command prompt. Test signing is used to allow developers to load drivers they are still working on that have not yet been code signed with an official certificate. This is actually one of the steps we need to do when loading our test fixes. For more information on Test Signing, see http://msdn.microsoft.com/en-us/library/ff553484%28v=VS.85%29.aspx.
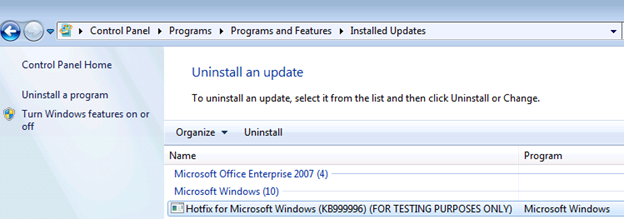
So now that you know what causes these various watermarks to appear, perhaps you’re wondering how to make the “For testing purposes only” message disappear. This is a question we are frequently asked. While you are running a test hotfix, there is no way to disable this message. Your only option is to remove the test hotfix from your system. This is something your engineer will ask you to do before you install the final, public version of a hotfix. You can easily identify and uninstall test hotfixes by going into Control Panel, Programs and Features, View Installed Updates, then look for hotfixes with the words FOR TESTING PURPOSES ONLY in their name, like the one shown in the image below. You may also notice that the KB number listed for these fixes is often a place holder, and not a real KB article ID.
Installed Updates Control Panel
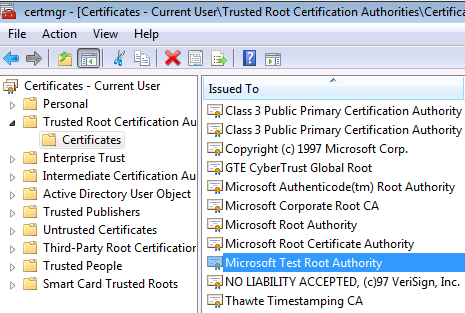
If the ‘For testing purposes only’ message is still displayed even after uninstalling the test hotfix, there is one more place to check. If a system has the Microsoft Test Root Authority certificate installed into its Trusted Root Certification Authorities store, the text will be displayed. We use this certificate to allow a PC to run test code that has been signed by our development team, but not yet fully tested and signed off with the official Microsoft certificate. To remove this certificate from your system, go to Start -> Run, and enter certmgr.msc and hit enter. In the Certificate Manager MMC, browse to Trusted Root Certification Authorities, then into Certificates. You should see one labeled Microsoft Test Root Authority, as shown below. This will need to be deleted and the system rebooted to remove the testing purposes message. Don’t do this if you still have a test hotfix installed though, as it would prevent that binary from continuing to function and may mean you can no longer boot in to Normal or Safe mode.
certmgr Trusted Root Certs
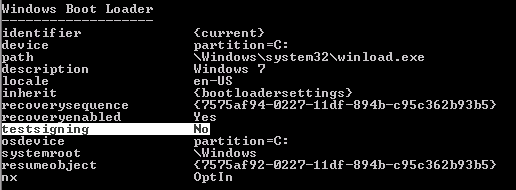
If you reboot and find that ‘Text Mode’ has replaced the ‘For testing purposes only’ text, you’ll need to launch a command prompt with administrative privileges, then run “bcdedit /set testsigning off” and reboot. You can always check if test signing is enabled by running “bcdedit /enum” and looking for this line:
bcdedit showing testsigning setting
That’s all for today. Hopefully this post helped clear up any confusion about our different desktop watermarks.
This is an archive post of content I wrote for the NTDebugging Blog on MSDN. Since the MSDN blogs are being retired, I’m transferring my posts here so they aren’t lost. The post has been back-dated to its original publication date.
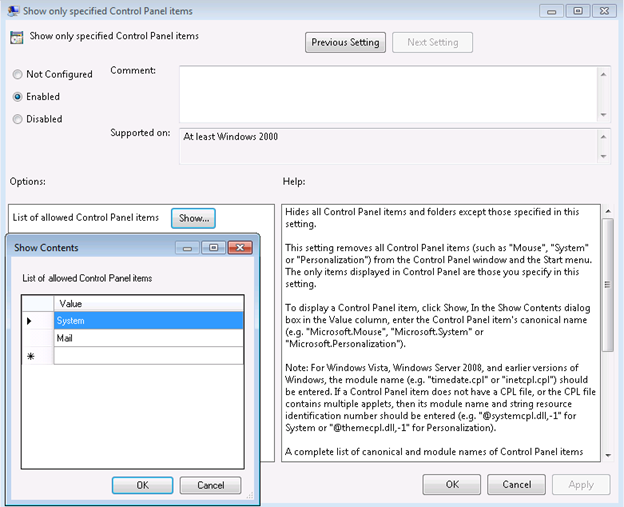
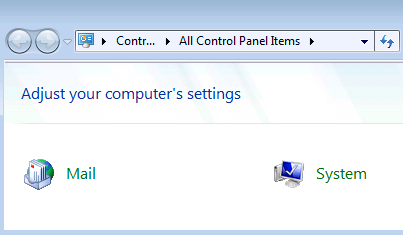
A customer recently reported a rather peculiar problem. They were working on a roll out of Windows 7, and one of the policies they employed on their domain was the “Show only specified control panel applets” setting. As its name implies, this policy allows an administrator to specify the names of any Control Panel icons they want their users to see, and all others are not shown. This company chose to allow a few of the Control Panel items included with Windows as well as the Mail icon that is added when Microsoft Office (specifically Outlook) is installed, which allows users to configure their Outlook profiles.
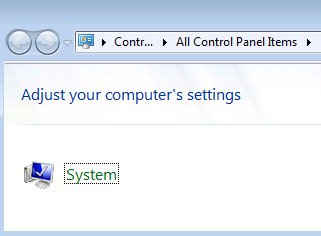
The problem the customer noticed was that, with the policy was in place, the first time a user opened the Control Panel on a computer, all of the allowed icons appeared except for Mail. If the user closed Control Panel and reopened it, the icon suddenly appeared. In fact, from that point on, the Mail icon would appear for that user on that computer. However, if that user logged on to a different computer, or a different user logged in to the first user’s computer, the icon was missing until Control Panel was opened for a second time.
Figure 1: Policy setting on our test systemFigure 2: Result from first openFigure 3: Result on subsequent opens (desired)
Control Panel isn’t something we get many cases on, so I had to figure out how it worked, and what would cause it to fail only the first time. One of the first things I discovered as I debugged the issue was that the Control Panel is actually loaded in two passes – a “fast” pass and a “slow” pass. This is done so icons we know will be loaded quickly can be displayed first so a user doesn’t get stuck with an empty window waiting for some of the slower icons to load. What makes an icon fast or slow? It turns out shell maintains a cache of Control Panel items, so it can display them quickly without having to query the actual item for its name, description, icon, etc. If we have to ask the item for its information, that will take longer, so it is loaded during the second, slow phase:
Luckily for these icons, they won’t stay relegated to slow loading status forever. During the slow loading phase, one of the things we do is add the item’s information to the Control Panel cache, so we can load it during the fast phase in the future.
This explains why the item was being loaded on subsequent opens of Control Panel – the item was added to the user’s cache on the first run, so the next time, it was loaded during the fast pass:
But that only answers half the question – while we now know why the icon appears every other time, we still don’t know why it doesn’t show up the first time. To figure this out, I debugged a system with the “Show only specified control panel applets” policy applied and one without the policy set, both as they opened Control Panel for the first time, and compared where the return codes from the functions diverged.
Starting with CControlPanelEnum::_NextNonCachedCpl, in the non-working case, we can see that it returns 0:
0:003> bp shell32!CControlPanelEnum::_NextNonCachedCpl
0:003> g
Breakpoint 0 hit
eax=14c5fa8c ebx=14c5fa7c ecx=11224630 edx=00000000 esi=11224630 edi=14c5fa8c
eip=76977e11 esp=14c5f9b4 ebp=14c5f9c8 iopl=0         nv up ei pl zr na pe nc
cs=001b  ss=0023  ds=0023  es=0023  fs=003b  gs=0000             efl=00000246
shell32!CControlPanelEnum::_NextNonCachedCpl:
76977e11 8bff            mov     edi,edi
0:020> k
ChildEBP RetAddr
14c5f9b0 76977dff shell32!CControlPanelEnum::_NextNonCachedCpl
14c5f9c8 768a854d shell32!CControlPanelEnum::Next+0x5a
14c5fa18 769710d2 shell32!CRegFolderEnum::Next+0x22e
14c5fa94 769783e7 shell32!CControlPanelAppletList::_AddAppletsToCategories+0x35
14c5fac4 76978353 shell32!CControlPanelAppletList::LoadSlowApplets+0x68
14c5faec 76974db4 shell32!CControlPanelDataWorkItem::_LoadSlowData+0x2e
14c5fb00 769e06ad shell32!CControlPanelDataWorkItem::DoWork+0x4b
14c5fb18 768d83a6 shell32!CFrameTask::InternalResumeRT+0x14
14c5fb38 7691639b shell32!CRunnableTask::Run+0xce
14c5fb54 76918c1f shell32!CShellTask::TT_Run+0x167
14c5fb9c 76918d53 shell32!CShellTaskThread::ThreadProc+0xa3
14c5fba4 760cb2b1 shell32!CShellTaskThread::s_ThreadProc+0x1b
14c5fbb4 77c8d877 shlwapi!ExecuteWorkItemThreadProc+0xe
14c5fc28 77c90842 ntdll!RtlpTpWorkCallback+0x11d [d:\w7rtm\minkernel\threadpool\compat\worker.c @ 284]
14c5fd80 00000000 ntdll!TppWorkerThread+0x572
0:020> gu			* <------------- This steps out to the instruction after the call to CControlPanelEnum::_NextNonCachedCpl in CControlPanelEnum::Next.
ModLoad: 35c70000 35c8b000   c:\progra~1\common~1\system\msmapi\1033\mlcfg32.cpl
eax=00000000 ebx=14c5fa7c ecx=bea347f1 edx=006d2904 esi=11224630 edi=14c5fa8c
eip=76977dff esp=14c5f9bc ebp=14c5f9c8 iopl=0         nv up ei pl zr na pe nc
cs=001b  ss=0023  ds=0023  es=0023  fs=003b  gs=0000             efl=00000246
shell32!CControlPanelEnum::Next+0x5a:
76977dff 84c0            test    al,al
But on the machine without the policy set, it returns 1:
So we know something in this function is causing us to return FALSE in the failing case and TRUE in the working case. An easy way to see where the return result of function calls is the wt (watch trace) debugger command with the -oR switch to see the return values. I set the level (-l) to 1 so I’d only see functions directly called from CControlPanelEnum::_NextNonCachedCpl. Here were the results.
Here, we can see that the function CControlPanelEnum::_CanEnumerateApplet returns true in the working case, but false in the failing case. This is what is causing the return value from _NextNonCachedCpl to differ, which is ultimately what causes the icon to load/not load. So let’s take a look at _CanEnumerateApplet. Using wt inside this function showed something rather interesting:
Looking at the two, we can see that they both call GetDetailsEx, but in the failing case we seem to get an error result: 80070002, and in the working case we get 0, and then proceed to call CPL_DoesPolicyAllow. CPL_DoesPolicyAllow is not called on the machine with the policy applied. A quick code review of CPL_DoesPolicyAllow showed that this function checks if a policy prevents or allows an item from being displayed. So if we can just get to that function, the icon will load. Now we need to know why GetDetailsEx fails, preventing us from calling CPL_DoesPolicyAllow. If we look up the error code, it is pretty generic:
0:020> !error 80070002
Error code: (HRESULT) 0x80070002 (2147942402) - The system cannot find the file specified.
Next I stepped through and into GetDetailsEx. I’ll save you the tedious steps and output, since the procedure is similar to what I’ve already shown above. Anyway, I was able to trace the error 2 as being returned by a call to the registry a few functions deep into GetDetailsEx:
This is good news, because it means we can find out what we’re looking for that we aren’t finding. First I stepped out to get back to CControlPanelFolder::_InitExtPropRegValNameCache. Sure enough, eax was 2, which is our ‘cannot find the file’ error.
0:020> gu
eax=00000002 ebx=00000000 ecx=778ac2da edx=00000002 esi=14c5eff0 edi=00000000
eip=76975ead esp=14c5ed40 ebp=14c5efc4 iopl=0         nv up ei pl zr na pe nc
cs=001b  ss=0023  ds=0023  es=0023  fs=003b  gs=0000             efl=00000246
shell32!CControlPanelFolder::_GetExtPropRegKey+0xb1:
76975ead 50              push    eax
0:020> !error 2
Error code: (Win32) 0x2 (2) - The system cannot find the file specified
Since we know that RegOpenKeyEx takes the subkey it is looking for as the second parameter, let’s look back at the assembly before the call to see what we passed in:
Remember that function parameters are passed in in reverse order, so the second parameter is the second to last value passed to the function. In this case, we can see that it was stored in eax. Of course, eax has been overwritten by our return value of 2, but we can see that just before pushing eax, we get the value from ebp-0x270. Dumping that out as a Unicode string, we get the key we were looking for:
Aha! So now we know we were trying to access “HKLM\ Software\Microsoft\Windows\CurrentVersion\Control Panel\Extended Properties\System.ApplicationName” which didn’t exist, so we were unable to proceed with loading the icon.
What’s that key for, you ask? MSDN tells us that it is used to store the Canonical Name of the Control Panel item. Canonical Names were added to the Control Panel in Windows Vista as a better way to organize and name the items in the Control Panel. By convention, the canonical name of “Mail” is “Microsoft.Office.Outlook.Profiles.” Because the “Show only specified control panel applets” policy can now accept either the legacy name (“Mail”) or the canonical name, we are checking the registry for this string. Since the key is not present, GetDetailsEx cannot determine the canonical name, and the icon does not load.
As a test, I created the key HKLM\ Software\Microsoft\Windows\CurrentVersion\Control Panel\Extended Properties\System.ApplicationName and added a REG_SZ to it with a name of the file location of the Mail CPL file (“C:\Program Files\Common Files\SYSTEM\MSMAPI\1033\MLCFG32.CPL”) and a value of “Microsoft.Office.Outlook.Profiles”. Sure enough, the icon loads up on the first try for new users.
While new Control Panel items should implement a canonical name, that doesn’t work for existing CPLs, like Mail from Outlook 2003. Since the canonical name isn’t actually required (CPL_DoesPolicyAllow works with both name formats), we’re following up with the development team to allow CPL_DoesPolicyAllow to be called even if a canonical name is not found.
A walk-through of creating a Netmon parser in the context of a real case
This is an archive post of content I wrote for the NTDebugging Blog on MSDN. Since the MSDN blogs are being retired, I’m transferring my posts here so they aren’t lost. The post has been back-dated to its original publication date.
As is obvious to frequent readers of our blog, our team logs a lot of time in our debugger of choice (for some, windbg, for others, kd). However, a debugger is not always the best tool for the job, and sometimes even the best tool has limitations. I found this to especially true when working a few Internet Printing Protocol (IPP) cases recently.
Probably the biggest challenge of many IPP cases is the mixed environments you usually find IPP running in. The benefit customers see in IPP over other print providers is it works natively or with minimal configuration on Windows, Mac, and Linux clients. This makes it popular in places like college computer labs, where there isn’t one standard client system. Unfortunately, this also means that we can’t really debug both sides of the communication when something goes wrong.
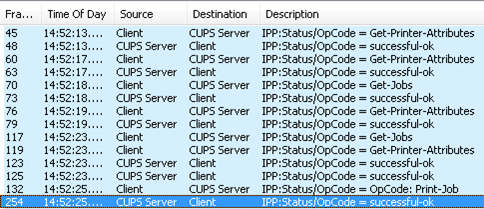
In a recent case, a customer was having problems printing from their Windows Vista clients to a Linux Common Unix Printing System (CUPS) IPP server. If the CUPS server was set to allow anonymous connections, everything worked perfectly. When the administrator enabled authentication, he found that most print jobs failed to print. After a bit more testing, he found that small jobs (perhaps a page of printed text) worked fine, but larger, multi-page documents failed.
For situations like this, I prefer to use a network trace to get a feeling for where the problem is occurring. The problem was – IPP wasn’t one of the protocols built in to Netmon (and I find Wireshark’s IPP parser to not always work well – especially with Windows clients/servers). I decided that the amount of time it would take to decode the traffic by hand could be better spent creating a Netmon IPP parser that I could use every time I ran into one of these issues.
One of the great things about Netmon is you can view the source of every included parser. This was a big help, as I hadn’t written a parser before. [Note: all steps noted are written using Netmon 3.4.There might be slight differences in NM3.3.] To do this, open Netmon and click the Parsers tab. Under Object View, expand parser files and double click any of the .npl files. The source will appear on the right.
The language for Netmon parsers is similar to C++, with a limited set of statements. These are all documented in the Netmon help file, but the ones I found useful are described below. To begin, I started by defining a number of tables. The basic idea of a table is to provide a way to convert a value to a string. For example, one field in an IPP packet is the status of a printer, which is represented by an integer. In order to allow Netmon to show printer states in a readable form, I created a table to convert the values as seen in Figure 1 below.
Table IPPPrinterState //2911-4.4.11
{
	switch(value)
	{
		case 3 : "idle";
		case 4 : "processing";
		case 5 : "stopped";
		default : "Unknown Code";
	}
}
Figure 1: Netmon Table
Each table is defined with the Table keyword, followed by a name for the table. (It may optionally be followed by a list of parameters, which I’ll use later. In this case, I added a comment that specified which RFC and section this information comes from.) A table consists of a switch statement with a case for each value, and a default for all other cases, much like other programming languages. I created tables like IPPPrinterState for each field that could be represented in an IPP packet from information I found in each of IPP’s RFCs.
Once the tables were complete, I moved on to creating the Protocol portion of the parser. This section of the code provides the logic that iterates through a packet and calls the tables for the appropriate data. This section starts with either the RegisterBefore or RegisterAfter keyword. These are used to determine how your parser is called. Essentially, Netmon takes all of the parsers it has, and compiles them into one continuous binary (.npb) and registration tells Netmon where your parser fits. For my case, I used the following registration code.
This tells Netmon that, when compiling the parser, it should insert my code right after the code for the OCSP protocol in its HTTPPayloadData parser, my protocol should be called IPP, and it should enter my code path if the HTTP Payload is of content type “application/ipp”. This allows my parser to work a bit differently than the Wireshark IPP parser – Wireshark uses a port number (631) to identify IPP traffic, whereas my code looks at HTTP content types. The advantage of this, for me, is that Windows servers use port 80 for IPP by default, not 631, so in cases with a Windows IPP server, this parser should correctly identify the packets. You may be wondering how or why I chose to register after OCSP. Basically, I knew I needed my code to be registered in the section of code where HTTP does its payload content type processing. So I opened up HTTP’s parser, and searched for the content type analysis. OCSP was the first protocol I found in HTTP’s content type logic, so I used that as the place to insert my protocol.
After the registration comes the Protocol statement. I chose the following.
This names my protocol IPP and specifies that I want the description of the protocol to display the IPP status code. This way, a user doesn’t need to drill down to find out if this is a print job or a printer status request. You’ll notice FormatString is a function in Netmon that is similar to printf. In this case, I am passing a variable (OpID, which is defined lower in my code) to my IPPOperationsSupported table to determine what this OpCode means. Before I had a parser, I would need to look up the operations supported values in the IPP RFC for each packet I examined.
Next is the body of the protocol. Basically, this consists of a series of fields (like variables) that define how a packet is laid out. Creating a field is similar to declaring a variable in C++. You start by choosing a data type that matches the size of the data in the packet and provide a name for that field. For example, Figure 2 shown below contains the first seven lines of my Protocol.
The IPP specification states that all packets begin with two 8-bit values, the first value specifies the major protocol version in use, and the second value specifies the minor. In this case, I wrapped both in a struct so Netmon will display them as “Version: 1.0”, instead of separately as “Major: 1” “Minor: 0” on two lines. After the version is a 16-bit field that specifies the operation requested (for example, print-job or get-printer-state). I choose to display this value by looking it up in the IPPOperationsSupported table, then printing it as the string, followed by the hex value (e.g. “Get-Printer-Attributes (0xB)”). The ‘this’ keyword simply uses the value of the current field, which in this case is the OpId. Even though Netmon parses through the packet sequentially, this kind of use of a Field before its value is retrieved is allowed. Finally, I set the RequestId field, which is a 32-bit int value. Since this field is just a transaction ID for this conversation, I don’t need to do any formatting to it.
After that, things got a little more complicated. IPP’s structure allows for a variable number of attribute groups, each of which can contain a variable number of attributes. For example, in response to the request “Get-Printer-Attributes” from the client, the server responds with the Printer Attributes group, which contains a number of attributes like printer-state, queued-job-count, and so on. First, I needed to deal with the attribute groups in a loop until I’d read each one. IPP specifies that the end of the attribute groups is specified with the value of 0x03, so I wrote a while loop to create attribute groups until FrameData[FrameOffset] is equal to 3 (See Figure 3 below). FrameData and FrameOffset are special values provided by Netmon. FrameData is an array of the entire contents of the frame, and FrameOffset is Netmon’s current location in the packet. I use this instead of declaring a field here because referencing FrameData[FrameOffset] does not advance the parser frame location. This is important because I want to consume that value further down.
Inside that loop, I declared another struct that contains an attribute group. Much like the Protocol IPP line above, we reference a field here that will be declared lower down. This line does not advance the FrameOffset, since we don’t declare a field here. The first line of this struct is the field declaration line that finally consumes the attribute group tag. Below that is another While loop to process all attributes in the attribute group. IPP differentiates between attributes and attribute groups by making all attribute group identifiers smaller than 0x10, and all attribute identifiers 0x10 or higher. I use this as the condition for my loop. Finally, I declare an Attribute struct inside this loop. This struct is displayed after looking up how to properly print based on the Attribute Name and Value in the AttribDisplayTable.
IPP declares attributes as an 8-bit type identifier (int, bool, string, etc.), a 16-bit int specifying the attribute name’s length, the name (a string), a 16-bit in value length, and a value. Since I want to look up the value in various tables, depending on the Attribute Name, I store the Attribute Name as “AttName” in a property. This way, I can continue to reference it while processing continues. Properties are declared in brackets just above the field they will store. In my case, I prepend the ‘Post.’ evaluation keyword to the property name. This instructs Netmon to use the end result of the next line as its value, but before advancing the FrameOffset. I do this again for the actual value, which I call Val. If I did not use the Post evaluation keyword, Val would contain the unsigned int32 value of printer state, instead of the formatted string result I get by looking up printer state in its table.
My case statements continue like printer-state for all possible attributes of IPP. At the very end of the protocol block, after I’ve closed my switch, structs, and whiles, I have one more line, which consumes any data remaining in the packet. This would contain document data if the packet was a print job, and is required so all the packet data is consumed before Netmon moves on to the next packet. That line is: BLOB (FrameLength – FrameOffset) Data;
As you can see, it is a binary blob data type, set to the size of the frame, less our current location.
Finally, after my Protocol block, I needed to define my own data type. IPP defines its own data format to specify printer uptime, so I created a data type for it as shown below in Figure 4.
The first line of Figure 4 specifies this will be a data type composed of numeric data named UPTIME. Size specifies how many bytes the type uses. DisplayFormat is what Netmon displays for this type. In this case, I use the x ? y : z syntax. Netmon doesn’t have if/then/else keywords, but instead uses this ternary operator. I use a special case for 0 since it seems to be a common return value in the traces I’ve looked at, and having ‘Uptime: 0 days 00:00:00 (0 seconds)’ seemed excessive.
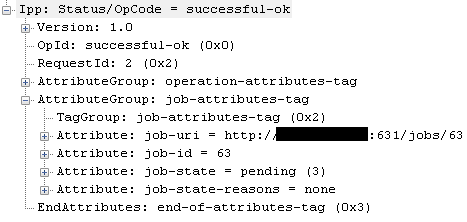
Figures 5 and 6 below show what the result looks like in Netmon.
Figure 5: Frame SummaryFigure 6: Frame Detail
So what did the trace show? Windows attempts to send IPP requests with no authentication first, then if it receives an access denied, retries with authentication. This is by design, as the IPP server replies with the authentication types it supports in the access denied message. In the case of print jobs that are too large to fit in a single packet, IPP’s spec allows servers to either issue the access denied message as soon as it receives the first packet, or after it has received the entire job. It turns out that the IPP Print Provider on Windows was designed to send the entire job before listening for a response, so it missed the access denied message that CUPS sent after it received the first packet. See http://support.microsoft.com/kb/976988/[New link https://support.microsoft.com/en-us/topic/you-may-be-unable-to-print-to-an-ipp-print-queue-in-windows-7-or-in-windows-server-2008-r2-44a0f58a-4894-f98c-4a82-ed66eeb84ded] for related information. Want a copy of the IPP parser? It will be included in a future release of the Netmon Parser Update[Archived at https://codeplexarchive.org/project/NMParsers, code also shown below].
I hope this post have given you a better idea of how Netmon works, how IPP works, and helps if you ever need to write a parser for your protocol.
-Matt Burrough
//#  (c) 2010 Outercurve Foundation
//#
//#  Title:                  Internet Printing Protocol v1.1
//#
//#  Details:
//#
//#  Public References:      RFC 2910, 2911, 3380, 3381, 3382, 3995, 3996, 3998, pwg5100.1, pwg5100.5, pwg5100.7, pwg5100.8
//#
//#  Comments:
//#
//#  Revision Class and Date:Major, 07/28/2011
//#
//####

[ RegisterAfter(HTTPPayloadData.OCSP, IPP, Property.HTTPContentType.Contains("application/ipp")) ]
Protocol IPP = FormatString(Property.HttpIsRequest == 0x1 ? "OperationID = " + IPPOperationsID(OperationID):"StatusCode = " + IPPStatusCodes(StatusCode))
{
	[ MaxLoopCount = 1 ]
	while [ FrameData[ FrameOffset ]==0x01 && FrameData[ FrameOffset + 1 ] <= 0x01 ] // Only support IPP v1.0/1.1 (latest version released)
	{
		struct Version = FormatString("%i.%i", Major, Minor)
		{
			INT8 Major;
			INT8 Minor;
		}

		switch
		{
			case Property.HttpIsRequest == 0x1:
				UINT16 OperationID = FormatString("%s (0x%X)", IPPOperationsID(this), this);
			case Property.HttpIsResponse == 0x1:
				UINT16 StatusCode = FormatString("%s (0x%X)", IPPStatusCodes(this), this);
			default:
				ReportParserError(ParserErrorProtocolClassWindows, "IPP", "Unknown Message" ) MessageError;
		}
		INT32 RequestId;

		While [ FrameData [ FrameOffset ] != 0x03 ]
		{
			struct AttributeGroup = FormatString("%s", IPPTags(TagGroup))
			{
				INT8 TagGroup = FormatString("%s (0x%X)", IPPTags(this), this);
				While [FrameData[FrameOffset] >= 0x10]
				{
					struct Attribute = FormatString("%s %s %s", AttName, DrawEquals(ValueLength), AttribDisplayTable(AttName, Ret))
					{
						INT8 Type = FormatString("%s (0x%X)", IPPTags(this), this);
						INT16 NameLength;
						[Post.AttName]
						AsciiString(NameLength) AttributeName;
						INT16 ValueLength;
						[Post.Val]
						ValueStr(AttName, Type, ValueLength) Value = AttribDisplayTable(AttName, Ret);

						while [FrameData[FrameOffset + 1] == 0 && FrameData[FrameOffset + 2] == 0]
						{
							struct AdditionalAttribute = AdditionalValue.ToString
							{
								INT8 AdditionalType = FormatString("%s (0x%X)", IPPTags(this), this);
								INT16 AdditionalNameLength;
								INT16 AdditionalValueLength;
								[PostAfter.Ret = "..."]
								ValueStr(AttName, AdditionalType, AdditionalValueLength) AdditionalValue = AttribDisplayTable(AttName, Ret);
							}
						}
					}
				}
			}
		}

		INT8 EndAttributes = FormatString("%s (0x%X)", IPPTags(this), this); // end-of-attribues tag
	}
	BLOB (FrameLength - FrameOffset) Data; // For things like print job binary data
}

// Tables of value codes from IPP RFCs
Table IPPTags(value) //2910-3.5
{
	switch(value)
	{
		// Delimiter Tags
		case 0x00 : "reserved";
		case 0x01 : "operation-attributes-tag";
		case 0x02 : "job-attributes-tag";
		case 0x03 : "end-of-attributes-tag";
		case 0x04 : "printer-attributes-tag";
		case 0x05 : "unsupported-attributes-tag";
		case 0x06 : "subscription-attributes-tag";
		case 0x07 : "event-notification-attributes-tag";
		case 0x09 : "document-attributes-tag"; // pwg5100.5

		// Value Tags
		case 0x10 : "unsupported";
		case 0x11 : "reserved";
		case 0x12 : "unknown";
		case 0x13 : "no-value";

		case 0x15 : "not-settable"; // 3380
		case 0x16 : "delete-attribute";
		case 0x17 : "admin-define";

		// Types
		case 0x20 : "reserved-generic-integer";
		case 0x21 : "integer";
		case 0x22 : "boolean";
		case 0x23 : "enum";

		// OctectString
		case 0x30 : "octetString with an  unspecified format";
		case 0x31 : "dateTime";
		case 0x32 : "resolution";
		case 0x33 : "rangeOfInteger";
		case 0x34 : "begCollection";
		case 0x35 : "textWithLanguage";
		case 0x36 : "nameWithLanguage";
		case 0x37 : "endCollection";

		// Character Strings
		case 0x40 : "reserved-generic-char-str";
		case 0x41 : "textWithoutLanguage";
		case 0x42 : "nameWithoutLanguage";
		case 0x43 : "reserved";
		case 0x44 : "keyword";
		case 0x45 : "uri";
		case 0x46 : "uriScheme";
		case 0x47 : "charset";
		case 0x48 : "naturalLanguage";
		case 0x49 : "mimeMediaType";
		case 0x4A : "memberAttrName"; // 3382

		case 0x7F : "Extension";

		default : "Unknown or Reserved Tag";
	}
}

Table IPPFinishing(value) // 2911-4.2.6
{
  switch(value)
  {
    case 3 : "none";
    case 4 : "staple";
    case 5 : "punch";
	case 6 : "cover";
	case 7 : "bind";
	case 8 : "saddle-stitch";
	case 9 : "edge-stitch";

	case 10 : "fold"; // pwg5100.1
	case 11 : "trim";
	case 12 : "blae";
	case 13 : "booklet-maker";
	case 14 : "jog-offset";

	case 20 : "staple-top-left";
	case 21 : "staple-bottom-left";
	case 22 : "staple-top-right";
	case 23 : "staple-bottom-right";
	case 24 : "edge-stitch-left";
	case 25 : "edge-stitch-top";
	case 26 : "edge-stitch-right";
	case 27 : "edge-stitch-bottom";
	case 28 : "staple-dual-left";
	case 29 : "staple-dual-top";
	case 30 : "staple-dual-right";
	case 31 : "staple-dual-bottom";

	case 50 : "bind-left";
	case 51 : "bind-top";
	case 52 : "bind-right";
	case 53 : "bind-bottom";

    default : "Unknown Code";
  }
}

Table IPPOrientationRequested(value) // 2911-4.2.10
{
	switch(value)
	{
		case 3 : "portrait";
		case 4 : "landscape";
		case 5 : "reverse-landscape";
		case 6 : "reverse-portrait";
		default : "Unknown Code";
	}
}

Table IPPPrintQuality(value) // 2911-4.2.13
{
	switch(value)
	{
		case 3 : "draft";
		case 4 : "normal";
		case 5 : "high";
		default : "Unknown Code";
	}
}

Table IPPJobCollation(value) // 3381-4.1
{
	switch(value)
	{
		case 1 : "Other";
		case 2 : "Unknown";
		case 3 : "Uncollated-Sheets";
		case 4 : "Collated-Documents";
		case 5 : "Uncollated-Documents";
		default : "Unknown Code";
	}
}

Table IPPJobState(value) // 2911-4.3.7
{
	switch(value)
	{
		case 3 : "pending";
		case 4 : "pending-held";
		case 5 : "processing";
		case 6 : "processing-stopped";
		case 7 : "canceled";
		case 8 : "aborted";
		case 9 : "completed";
		default : "Unknown Code";
	}
}

Table IPPDocumentState(value) // pwg5100.5
{
	switch(value)
	{
		case 3 : "Pending";
		case 5 : "Processing";
		case 7 : "Canceled";
		case 8 : "Aborted";
		case 9 : "Completed";
		default : "Unknown State";
	}
}

Table IPPPrinterState(value) // 2911-4.4.11
{
	switch(value)
	{
		case 3 : "idle";
		case 4 : "processing";
		case 5 : "stopped";
		default : "Unknown Code";
	}
}

Table IPPUnits(value) // 2911-4.1.15
{
	switch(value)
	{
		case 3 : "dpi";
		case 4 : "dpcm";
	}
}

Table IPPOperationsID(value) // 2911-4.4.15
{
	switch(value)
	{
		// Op Codes
		case 0x0000 : "reserved";
		case 0x0001 : "reserved";
		case 0x0002 : "Print-Job";
		case 0x0003 : "Print-URI";
		case 0x0004 : "Validate-Job";
		case 0x0005 : "Create-Job";
		case 0x0006 : "Send-Document";
		case 0x0007 : "Send-URI";
		case 0x0008 : "Cancel-Job";
		case 0x0009 : "Get-Job-Attributes";
		case 0x000A : "Get-Jobs";
		case 0x000B : "Get-Printer-Attributes";
		case 0x000C : "Hold-Job";
		case 0x000D : "Release-Job";
		case 0x000E : "Restart-Job";
		case 0x000F : "reserved";
		case 0x0010 : "Pause-Printer";
		case 0x0011 : "Resume-Printer";
		case 0x0012 : "Purge-Jobs";
		case 0x0013 : "Set-Printer-Attributes"; // 3380
		case 0x0014 : "Set-Job-Attributes";
		case 0x0015 : "Get-Printer-Supported-Values";
		case 0x0016 : "Create-Pritner-Subscriptions"; // 3995
		case 0x0017 : "Create-Job-Subscriptions";
		case 0x0018 : "Get-Subscription-Attributes";
		case 0x0019 : "Get-Subscriptions";
		case 0x001A : "Renew-Subscription";
		case 0x001B : "Cancel-Subscription";
		case 0x001C : "Get-Notifications"; // 3996
		case 0x0021 : "Get-Client-Printer-Support-Files"; // http://www.ietf.org/proceedings/48/I-D/ipp-install-00.txt
		case 0x0022 : "Enable-Printer"; // 3998
		case 0x0023 : "Disable-Printer";
		case 0x0024 : "Pause-Printer-After-Current-Job";
		case 0x0025 : "Hold-New-Jobs";
		case 0x0026 : "Release-Held-New-Jobs";
		case 0x0027 : "Deactivate-Printer";
		case 0x0028 : "Activate-Printer";
		case 0x0029 : "Restart-Printer";
		case 0x002A : "Shutdown-Printer";
		case 0x002B : "Startup-Printer";
		case 0x002C : "Reprocess-Job";
		case 0x002D : "Cancel-Current-Job";
		case 0x002E : "Suspend-Current-Job";
		case 0x002F : "Resume-Job";
		case 0x0030 : "Promote-Job";
		case 0x0031 : "Schedule-Job-After";
		case 0x0033 : "Cancel-Document"; // pwg5100.5
		case 0x0034 : "Get-Document-Attributes";
		case 0x0035 : "Get-Documents";
		case 0x0036 : "Delete-Document";
		case 0x0037 : "Set-Document-Attributes";

		// Vendor-Specific codes (0x4000-0xFFFF) (http://www.pwg.org/ipp/opcodes/ippopcodes.html)
		case 0x4000 : "Microsoft Specific Auth";
		case 0x4001 : "CUPS-Get-Default"; // http://www.cups.org/documentation.php/spec-ipp.html
		case 0x4002 : "CUPS-Get-Printers";
		case 0x4003 : "CUPS-Add-Modify-Printer";
		case 0x4004 : "CUPS-Delete-Printer";
		case 0x4005 : "CUPS-Get-Classes";
		case 0x4006 : "CUPS-Add-Modify-Class";
		case 0x4007 : "CUPS-Delete-Class";
		case 0x4008 : "CUPS-Accept-Jobs";
		case 0x4009 : "CUPS-Reject-Jobs";
		case 0x400A : "CUPS-Set-Default";
		case 0x400B : "CUPS-Get-Devices";
		case 0x400C : "CUPS-Get-PPDs";
		case 0x400D : "CUPS-Move-Job";
		case 0x400E : "CUPS-Authenticate-Job";
		case 0x400F : "CUPS-Get-PPD";
		case 0x4010 : "Peerless Systems Specific";
		case 0x401A : "novell-list-printers"; // https://www1.ietf.org/mail-archive/text/ipp/2008-03.mail
		case 0x401B : "novell-list-drivers";
		case 0x401C : "novell-mgmt-interface";
		case 0x401D : "novell-resource-add";
		case 0x401E : "novell-resource-list";
		case 0x401F : "novell-resource-delete";
		case 0x4020 : "novell-resource-download";
		case 0x4021 : "novell-get-driver-profile";
		case 0x4022 :
		case 0x4023 :
		case 0x4024 :
		case 0x4025 : "Novell Specific";
		case 0x4026 : "Xerox Specifc";
		case 0x4027 : "CUPS-Get-Document";

		default : "Unknown Operations ID";

	}
}

Table IPPStatusCodes(value) // 2911-4.4.15
{
	switch
	{
		// Status Codes
		// 0x0000:0x00FF - "successful"
		case value == 0x0000 : "successful-ok";
		case value == 0x0001 : "successful-ok-ignored-or-substituted-attributes";
		case value == 0x0002 : "successful-ok-conflicting-attributes";
		case value == 0x0003 : "successful-ok-ignored-subscriptions";
		case value == 0x0005 : "successful-ok-too-many-events";
		case value == 0x0007 : "successful-ok-events-complete";

		case value >= 0x0100 && value <= 0x01FF: "informational";

		case value >= 0x0300 && value <= 0x03FF: "redirection";

		// 0x0400:0x04FF - "client-error"
		case value == 0x0400 : "client-error-bad-request";
		case value == 0x0401 : "client-error-forbidden";
		case value == 0x0402 : "client-error-not-authenticated";
		case value == 0x0403 : "client-error-not-authorized";
		case value == 0x0404 : "client-error-not-possible";
		case value == 0x0405 : "client-error-timeout";
		case value == 0x0406 : "client-error-not-found";
		case value == 0x0407 : "client-error-gone";
		case value == 0x0408 : "client-error-request-entity-too-large";
		case value == 0x0409 : "client-error-request-value-too-long";
		case value == 0x040A : "client-error-document-format-not-supported";
		case value == 0x040B : "client-error-attributes-or-values-not-supported";
		case value == 0x040C : "client-error-uri-scheme-not-supported";
		case value == 0x040D : "client-error-charset-not-supported";
		case value == 0x040E : "client-error-conflicting-attributes";
		case value == 0x040F : "client-error-compression-not-supported";
		case value == 0x0410 : "client-error-compression-error";
		case value == 0x0411 : "client-error-document-format-error";
		case value == 0x0412 : "client-error-document-access-error";
		case value == 0x0413 : "client-error-attributes-not-settable"; // 3380
		case value == 0x0414 : "client-error-ignored-all-subscriptions"; // 3995
		case value == 0x0415 : "client-error-too-many-subscriptions";
		case value == 0x0417 : "clnt-err-client-print-support-file-not-found"; // http://www.ietf.org/proceedings/48/I-D/ipp-install-00.txt

		//0x0500:0x05FF - "server-error"
		case value == 0x0500 : "server-error-internal-error";
		case value == 0x0501 : "server-error-operation-not-supported";
		case value == 0x0502 : "server-error-service-unavailable";
		case value == 0x0503 : "server-error-version-not-supported";
		case value == 0x0504 : "server-error-device-error";
		case value == 0x0505 : "server-error-temporary-error";
		case value == 0x0506 : "server-error-not-accepting-jobs";
		case value == 0x0507 : "server-error-busy";
		case value == 0x0508 : "server-error-job-canceled";
		case value == 0x0509 : "server-error-multiple-document-jobs-not-supported";
		case value == 0x050A : "server-error-printer-is-deactivated"; // 3398
		case value == 0x050B : "server-error-too-many-jobs"; // pwg5100.7
		case value == 0x050C : "server-error-too-many-documents";

		default : "Unknown Status Code";
	}
}

Table DrawEquals(ValLen)
{
	switch(ValLen)
	{
		case 0 : "";
		default : "=";
	}
}

// Tables for displaying attribute summaries
Table AttribDisplayTable(Attrib, Val)
{
	switch(val)
	{
		case "..." : // Don't try to format multi-value attributes
			FormatString("%s", Val);
		default:
			AttribFormatTable(Attrib, Val);
	}
}

Table AttribFormatTable(Attrib, Val)
{
	switch(Attrib)
	{
		case "printer-state" :
			FormatString("%s (%u)", IPPPrinterState(Val),Val);

		case "finishings" :
		case "finishings-actual" : // pwg5100.8
			FormatString("%s (%u)", IPPFinishing(Val),Val);

		case "orientation-requested" :
		case "orientation-requested-actual" : // pwg5100.8
			FormatString("%s (%u)", IPPOrientationRequested(Val),Val);

		case "print-quality" :
		case "print-quality-actual" : // pwg5100.8
			FormatString("%s (%u)", IPPPrintQuality(Val),Val);

		case "job-state" :
			FormatString("%s (%u)", IPPJobState(Val),Val);

		case "job-collation-type" : // 3381
			FormatString("%s (%u)", IPPJobCollation(Val),Val);

		case "document-state" :
			FormatString("%s (%u)", IPPDocumentState(Val),Val);

		case "operations-supported" :
			FormatString("%s (%u)", IPPOperationsID(Val),Val);

		case "printer-is-accepting-jobs" :
		case "multiple-document-jobs-supported" :
		case "color-supported" :
			(Val!=0) ? FormatString("TRUE (0x01)") : FormatString("FALSE (0x00)");

		case "time-at-creation" :
		case "time-at-processing" :
		case "time-at-completed" :
		case "job-printer-up-time" :
		case "printer-up-time" :
			FormatString("%i days %02i:%02i:%02i (%i seconds)",
				(Val/86400), // Days
				(Val-((Val/86400)*86400))/3600, // Hours
				(Val-(((Val/86400)*86400)+(((Val-((Val/86400)*86400))/3600)*3600)))/60, // Minutes
				(Val%60),
		 		Val);

		default :
			FormatString("%s", Val);
	}
}

// Uptime format spec
Number UPTIME
{
	Size = 4;
	DisplayFormat = FormatString("%i days %02i:%02i:%02i (%i seconds)",
		(this / 86400), // Days
		(this - ((this / 86400) * 86400)) / 3600, // Hours
		(this - (((this / 86400) * 86400) + (((this - ((this / 86400) * 86400)) / 3600) * 3600))) / 60, // Minutes
		(this % 60), // Seconds
 		this) // Total secs
}

struct ValueStr(AttName, Type, ValueLength) = Ret
{
	switch(AttName)
	{
		case "printer-state" :
			[Ret]
			UINT32 PrinterState = FormatString("%s (%u)", IPPPrinterState(this),this);

		case "finishings" :
		case "finishings-actual" : // pwg5100.8
			[Ret]
			UINT32 Finishings = FormatString("%s (%u)", IPPFinishing(this),this);

		case "orientation-requested" :
		case "orientation-requested-actual" : // pwg5100.8
			[Ret]
			UINT32 Orientation = FormatString("%s (%u)", IPPOrientationRequested(this),this);

		case "print-quality" :
		case "print-quality-actual" : // pwg5100.8
			[Ret]
			UINT32 PrintQuality = FormatString("%s (%u)", IPPPrintQuality(this),this);

		case "job-state" :
			[Ret]
			UINT32 JobState = FormatString("%s (%u)", IPPJobState(this),this);

		case "job-collation-type" : // 3381
			[Ret]
			UINT32 JobCollation = FormatString("%s (%u)", IPPJobCollation(this),this);

		case "document-state" :
			[Ret]
			UINT32 DocumentState = FormatString("%s (%u)", IPPDocumentState(this),this);

		case "operations-supported" :
			[Ret]
			UINT32 OperationsSupported = FormatString("%s (%u)", IPPOperationsID(this),this);

		case "time-at-creation" :
		case "time-at-processing" :
		case "time-at-completed" :
		case "job-printer-up-time" :
		case "printer-up-time" :
			[Ret]
			UPTIME TimeValue;

		default :
			switch(Type)
			{
				case 0x20 :
					[Ret]
					INT32 ReservedIntValue;
				case 0x21 :
					[Ret]
					INT32 IntValue;
				case 0x22 :
					[Ret]
					BOOLEAN BoolValue;
				case 0x23 :
					[Ret]
					UINT32 EnumValue;

				// OctectString
				case 0x31 :  //2911 4.1.14 --> RFC1903
					[Ret]
					struct DateAndTime = FormatString("%u-%u-%u,%u:%u:%u.%u,%c%u:%u", Year, Month, Day, Hour, Minute, Second, DeciSec, DUTC, HUTC, MUTC)
					{
						//			   DISPLAY-HINT "2d-1d-1d,1d:1d:1d.1d,1a1d:1d"
										// field  octets  contents   		   range
					        			// -----  ------  --------			  -----
						UINT16 Year;	//   1      1-2   year*                 0..65536
						UINT8 Month;	//   2       3    month                 1..12
						UINT8 Day;		//   3       4    day                   1..31
						UINT8 Hour;		//   4       5    hour                  0..23
						UINT8 Minute;	//   5       6    minutes               0..59
						UINT8 Second;	//   6       7    seconds               0..60  (use 60 for leap-second)
						UINT8 DeciSec;	//   7       8    deci-seconds          0..9
						CHAR DUTC;		//   8       9    direction from UTC	'+' / '-'
						UINT8 HUTC; 	//   9      10    hours from UTC*       0..13
						UINT8 MUTC; 	//  10      11    minutes from UTC      0..59

					    // For example, Tuesday May 26, 1992 at 1:30:15 PM EDT would be
					    // 1992-5-26,13:30:15.0,-4:0
					}
				case 0x32 : //2911 4.1.15 "resolution" --> RFC1759
					[Ret]
					struct Resolution = FormatString("%ix%i %s",CrossFeedRes, FeedRes, IPPUnits(Units))
					{
						INT32 CrossFeedRes;
						INT32 FeedRes;
						INT8 Units;
					}
				case 0x33 : // "rangeOfInteger"
					[Ret]
					struct Range = FormatString("%i-%i",lower, upper)
					{
						INT32 lower;
						INT64 upper;
					}
				default:
					[Ret]
					AsciiString(ValueLength) StringValue;
			}
	}
}
This is an archive post of content I wrote for the NTDebugging Blog on MSDN. Since the MSDN blogs are being retired, I’m transferring my posts here so they aren’t lost. The post has been back-dated to its original publication date.
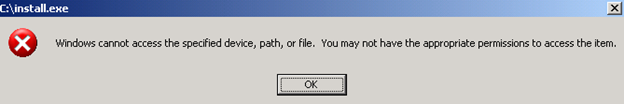
Recently I received a debug request for a customer having problems running large executables. On their systems, they could run most EXEs without any problems, but they had two programs that were over 1.8 GB which, when run, would display the following error:
Error message stating “Windows cannot access the specified device, path, or file. You may not have the appropriate permissions to access the item.”
If they tried to run them in a command prompt, they received the message “Access is denied.” Both attempts were made with an administrator account and in neither case were the processes created. Through testing, they found that the programs worked if they were scheduled to run as System and also worked when run in safe mode as an administrator.
When the case was brought to my attention, it was noted that when the failing executables were run, the following appeared in process monitor logs:
Process Monitor Log showing Invalid Parameter result when trying to start exe.
The engineer did not see this when one of the problematic EXEs was run (successfully) on his test machine. The customer provided a VM image of their system which we set up in HyperV with a named pipe kernel debugger. I then started kernel debugging to find the cause of the INVALID PARAMETER error, hoping that resolving it would fix the issue.
To start, I looked at the call stack within process monitor for the invalid parameter:
Call stack of the process start in ProcMon
The problem is this isn’t exactly where we return invalid parameter. Looking at the source code for Fltmgr, it doesn’t return invalid parameter – this was just where the error was caught in procmon. This call stack did provide some ideas for good starting places to debug, however. First, I looked up the hex value for STATUS_INVALID_PARAMETER in ntstatus.h – 0xC000000D. Knowing this, I decided to set a breakpoint on nt!IofCallDriver and ran the program. Once the debugger broke in, I planned to use wt -oR. This will trace through the calls displaying the return values next to each call. From there, I would just need to find 0xc000000d on the return column. Unfortunately, I had forgotten was wt does not display return codes in kernel debugging, only when debugging user mode.
With wt not an option, I decided to use a combination of debugger commands to approximate the output of wt. I knew the return value I was looking for, and I was also confident that I would find that code in the EAX register after the problem occurred. As such, I needed to write a loop that would walk through the instructions until it found 0xC000000D in EAX. The debugger provides two main options for walking instructions: p and t. p (Step) will execute a single instruction and display the register values. If the instruction is a call, it will not enter that function, but just display the results after that subroutine has been executed. t (Trace) also executes a single instruction, but it will enter into the function and will display each instruction.
In this case I wanted trace so I could see which function was returning the invalid parameter status. Tracing though that many instructions/functions would take a long time, but there are some variations on t (and p) that can help. tc (or pc)will execute instructions until a call statement is reached, where it will break and show the register values. tt (or pt) will execute instructions until a return instruction is reached. tct (or pct) will run until either a call or return is reached. In this case, I opted for tct.
Knowing that I would use tct, I had to find a way to execute tct statements until EAX was the value I was looking for. This can be accomplished with the z (While) debugger command. The syntax is pretty easy, it’s just z(expression) and it works just like a do-while loop. Putting it all together, I used this command in the debugger:
tct; z(eax!=0xc000000d)
I then waited for the debugger to break in so I could see where this status was being thrown. Regrettably, the code called ended up going in to some recursion which made my while loop take way too long. To resolve this, I set a new breakpoint just before we entered the recursion, reran the program, used p to step past the call then ran the tct loop.
This time I was quickly brought to the code I was looking for. As soon as it broke in, I ran k to view the callstack:
If we look at the assembly around Ntfs!NtfsCommonDeviceControl+0x40, we see that mov 0xC000000D in to esi, then mov esi to eax if our return from NtfsDecodeFileObject isn’t 4:
I looked at the source code for these functions, and it didn’t make sense that a failure here would cause the problems we were seeing; especially specific to large executables. Out of curiosity I ran notepad on the VM while logging in perfmon and found that it too displayed INVALID PARAMETER, but the program stated and ran correctly:
Invalid Parameter result for app that works
Since this wasn’t the problem, I stopped reviewing the code and decided on a new approach. We knew that when running the EXE in a command prompt we received an Access is denied message. At that point it made sense to switch to user mode debugging and take a look at the cmd.exe process that was trying to launch install.exe.
Doing user mode debugging in a VM can be a bit of a challenge, especially if you are trying to minimize changes to the VM (and in my case, avoid putting any symbols on the customer’s VM image). Since I already had a kernel debugger attached, one option would be to run ntsd.exe (debugger provided in the Debugging Tools for Windows) on the VM with the -p switch specifying the PID of the cmd.exe process I wanted to debug and -d switch which forwards the i/o of ntsd to the kernel debugger. The problem with this approach is the kernel debugger just becomes a front end for issuing commands and seeing the output from ntsd. That means all symbol resolution is still done on the target system running ntsd.
I didn’t want give the customer VM Internet or corporate network access, so I instead opted to run dbgsrv.exe on the VM. Running “dbgsrv -t tcp:port=9999” tells the debug server to listen on TCP port 9999 for debugger connections. Then, on the HyperV server computer I could just run windbg -premote tcp:server=(IP of VM),port=9999 -p (PID of cmd on VM) to debug it.
I suspected that we may be calling CreateProcess but it was failing, so I set a breakpoint kernel32!CreateProcessW. Sure enough, it hit when I tried to run install.exe in the command prompt:
This time I could use wt -oR since this was a usermode debug. Looking in ntstatus.h again, the code for STATUS_ACCESS_DENIED is 0xC0000022. Running wt can take a very long time, so I used the -l switch, which limits the number of levels deep it will display. This would be something like using tct as I did above until you were a few calls deep then using pct. Using wt -l 3 -oR gave me the following:
The depth is shown in brackets. As this call was 1 deep from __CodeAuthzpCheckIdentityHashRules and I was using 3 as my maximum depth in wt, I knew this is where the access denied was coming from. I reviewed the source code and found that this is the code that performs Software Restriction Policy checking. Specifically, we are attempting to map the executable into memory to perform hash checking on it. Since there isn’t 1.8 GB of contiguous available memory, it failed. Looking at the VM, I discovered that the customer had implemented a number of software restriction policies. As a test, I removed their restrictions on the VM, and the programs ran successfully. A search of the KB revealed that a hotfix was published for this problem: 973825. Installing the hotfix in the article also resolved the issue with their policies intact.
This is an archive post of content I wrote for the NTDebugging Blog on MSDN. Since the MSDN blogs are being retired, I’m transferring my posts here so they aren’t lost. The post has been back-dated to its original publication date.
Hi, this is Matt from the Windows Performance team. Sometimes we are presented with problems that defy our usual troubleshooting and require a creative approach. In a recent case, we needed a way to test the responsiveness of an application as text was typed into its fields. Initially, we tested the program using a script that used the SendKeys method to time entry time. Unfortunately, these tests aren’t completely realistic, since the script can be affected by the processor utilization on the system, and the script can’t create hardware interrupts like a keyboard does. Realizing that only real keyboard input would be a valid test, and that the rate of typing needed to be reproduced exactly for each test, I set about building an automated keyboard.
First, I found an old PS/2 style keyboard that hadn’t been used in years and opened it up. Luckily, it was old enough to use all through-hole components, which made it easier to modify. The main component I cared about was the keyboard encoder, which was a COP943C. A search online turned up a datasheet for the keyboard encoder with a sample circuit design that looked very similar to this keyboard. The document shows there are a couple of steps to determining which pins need to be shorted to generate a particular key. First, each key has an ID number that is shown in figure one of the PDF (figure one below). After finding the proper ID, a table is consulted to determine the row and column pins used to create that key code (figure two below). Finally, those row and column numbers are translated into physical pins on the encoder using the schematic diagram (figure three below). For example, the letter ‘a’ is number 31. The matrix shows 31 is made with the L5 (column 6) pin and C6 (row 3) pin. The pin out shows this to be physical pins 14 and 19. When tested, shorting these pins creates an ‘a’.
See the Video:
Matt explaining the automatic keyboardFigure 1: Key Codes [i]Figure 2: Key Code Matrix [i]Figure 3: Encoder Pin Out [i]
Now that we know how the keyboard circuit works, we need a method to generate key “presses.” For this, I found a board I assembled a year or two ago using a PCB and components from moderndevice.com. The board is an Arduino clone that is based on Atmel’s ATmega168 microcontroller. One of the great things about using an Arduino is their IDE, which allows for C programming with a number of pre-defined functions to make development quick. Also, the boot loader is already taken care of, which makes the work easier.
Wiring the board to the keyboard was straightforward. Figure 4 shows how to control a relay with an Arduino, and triggering a keyboard is rather similar. A resistor is placed between a digital out pin of the Arduino and the base pin of a transistor. The collector then goes to one pin of the keyboard encoder needed to type the letter desired, and the emitter goes to the other pin.
Figure 4: Arduino-controlled Relay [ii]
In order to save on solder joints, I decided to chain together the transistors, which affected the key selection. Additionally, because I wanted to leave the encoder in the original circuit and some of the pins were blocked by other components (resistors, capacitors), specific pins were selected. Figure 5 shows the layout of the transistors. These were soldered to a prototyping board with hook up wire to connect back to a breadboard with resistors and the Arduino and hook up wire soldered directly to the pins of the keyboard encoder.
Figure 5: Transistor Layout
These pins selected allowed characters a, s, z, space, and enter to be typed. All that remained was to write some software to trigger the transistors. The code first sets the digital pins to output and logic low, turns on a LED to show it is working, then waits 3 minutes to allow time for the PC to boot and application in question to be launched. The LED then goes out for a five second warning, and then the loop sequence begins. The loop turns on the LED, types “as z” followed by enter, then turns off the LED and sleeps for 2.5 seconds before starting again.
// Sample code to drive keyboard encoder
// Matt Burrough
// September, 2008

int ledPin = 13; // Use digital pin 13 for a status LED
int sPin = 3; // Connect pin 3 to the transistor connected to the s leads
int aPin = 4; // Pin 4 is for a
int zPin = 5; // Pin 5 is z
int enterPin = 6; // Pin 6 is enter
int spacePin = 7; // Pin 7 is space
int holdKey = 30; // Milliseconds to "hold" each key down
int betweenKeys = 50; // Milliseconds to wait between key presses

void setup() { // Initial setup code (runs at power-on)
    setupPin(ledPin); // Set up each pin with function below
    setupPin(sPin);
    setupPin(aPin);
    setupPin(zPin);
    setupPin(enterPin);
    setupPin(spacePin);
    digitalWrite(ledPin, HIGH); // Turn on the LED to show the board is on
    delay(180000); // Wait 3 minutes to allow time for PC to boot
    digitalWrite(ledPin, LOW); // Turn off the LED
    delay(5000); // Wait 5 seconds
}

void loop() {
    digitalWrite(ledPin, HIGH); // Turn the LED on
    typeKey(aPin); // Type keys
    typeKey(sPin);
    typeKey(spacePin);
    typeKey(zPin);
    typeKey(enterPin);
    digitalWrite(ledPin, LOW); // Turn the LED off
    delay(2500); //Pause 2.5 seconds
}

void setupPin(int pin) { // Used to set up pins...
    pinMode(pin, OUTPUT); // Set the digital pin as output
    digitalWrite(pin, LOW); // Turn off the pin
}

void typeKey(int pin) { // Type a key...
    digitalWrite(pin, HIGH); // "Press down" on a key
    delay(holdKey); // Hold down the key
    digitalWrite(pin, LOW); // "Release" the key
    delay(betweenKeys); // Pause between keys
}
Figure 6: Code Sample
That’s how I made an automated keyboard. I hope that you’ve found this post interesting; I’ll leave you with a photo of the finished product.