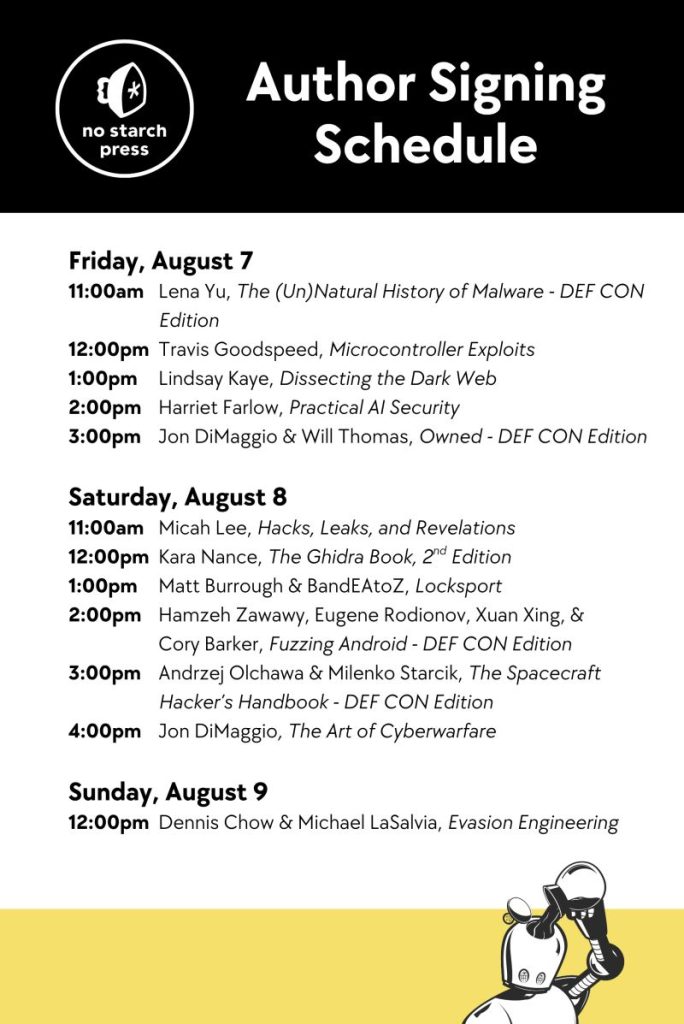
Lock Timer Update

Just in time for HushCon this year, I released a new version of the Lock Timer app. This is the first major update of the app since I built my original set of lock stands back in 2017. Changes include:

  • Added single-player mode
  • Added maximum time support
  • Made the UI layout support non-standard resolutions
  • Updated code to support Python 3.9.x
  • Updated code to support GuiZero 1.5.0

Enjoy! Let me know if you build your own timer game!

Screenshot of Lock Timer UI

Thanks DEF CON 31!

Thanks to everyone who came by to visit our book signing! We had a great time meeting you and hope you enjoy the early release of Locksport or Pentesting Azure Applications! I’m also excited to say that today we submitted the penultimate edits for Locksport to the production team — just one more review once the page numbers are locked to verify the index and the final version is off to the printer!

Also thanks to Max for the shoutout in the DEF CON media video interview!

Pre-Order Locksport book for pickup at DEF CON 31!

I’m excited to announce that we will have an early release version of our new book, Locksport, available in print at DEF CON 31 this August! Even better, several of the authors (including me!) will be at the No Starch Press booth to sign copies! You should pre-order the book now, as it will sell out. Pre-orders close July 7, so don’t wait. The book signing will be on Saturday, August 12th at 1pm.

Pre-order here.

More information about the book is here.

Seattle Locksport is Back!

As one of the organizers of Seattle Locksport, I am excited to announce that we are resuming in-person meetups! We took a long break due to COVID, but we are ready to see everyone again. We will be meeting near Seattle on the east side the third Tuesday every month at 7 PM. Our first meetup will be at NW Brewing in Redmond. RSVP if you can join us!

My team is hiring!

Are you interesting in joining a world-class Red Team? We are currently hiring pentesters/red teamers for the Microsoft internal Red Team. We have an excellent team of offensive security engineers, and are excited to grow the team. Check out the job posting here, or reach out to me if you have any questions.

Locksport Available for Pre-Order

I’m very excited to announce that my second book, Locksport, is available for pre-order from Amazon and No Starch Press. My coauthors and I have worked very hard to share everything we think you’ll need to learn the ins-and-outs of various locksport skills. Each section is brought to you by a world-renowned Locksporter:

  • How to identify types of locks, their parts, take them apart and modify them [me]
  • Pin-Tumbler lock picking [Walter Belgers, TOOOL NL president emeritus & lock picking champion]
  • Impressioning [Jos Weyers, TOOOL NL president & impressioning champion]
  • Safe lock manipulation (safe cracking) [Bandeatoz, safe expert]
  • Lever lock picking [Nigel K. Tolley, lock picking champion & professional locksmith]
  • Other lock-related contests [joint work]

I can’t wait for everyone to get to read it.

Locksport Cover

Azure Sentinel at Home

As I mentioned last time, I’ve been running Azure Sentinel against my home network to see how well I can detect unusual events or malicious activity at home. For most people, running a commercial SIEM solution at home is ridiculously overkill – admittedly that’s probably true for me as well. However, while I do red teaming at work, it’s always good to take some time to learn the tools used by the blue team and what better way than to use them to protect a network I care about?

So… what kind of network am I monitoring? Let’s take a look at my LAN. My entire network is built using Ubiquiti hardware. I have a UDM Pro that acts as my router, security appliance, and network configuration controller. For the core of the network I have a Ubiquiti EdgeSwitch 48. This switch is the sole connection to the UDM. The EdgeSwitch then feeds several Unifi APs, as well as several 8-port Unifi switches located at key places like the entertainment center and my desk. The network consists of several VLANs and SSIDs. There are VLANs for my IOT devices, my computers, my security cameras, my VOIP devices, guest devices, and a management network for the network gear itself.

You might be thinking – IOT network? At a red teamer’s house? Yep, I know. I follow accounts like Internet of Shit and am highly skeptical of these devices. But I’m also a tech geek at heart – always have been – and don’t want to forgo all the cool blinky things just because security was item #37 on their developer’s priority list. That’s why they get an isolated network. Same deal with the security cameras, running who-knows-what kind of terrible firmware. And that’s another reason why having Sentinel monitoring is a good idea.

What do you need to start monitoring? Well, for starters you’re going to need an Azure subscription. Azure subscriptions themselves are free, you simply get charged for usage of services you provision in the subscription. The amount of data you end up pumping in to Sentinel will determine the cost. Luckily if you are just trying out Sentinel for non-production workloads, there are a few options to get free credits. If you have a Visual Studio subscription, you get up to $150/month in free credits. If you’re just signing up for a new Azure account, you could get a one-time $200 credit. Microsoft also runs a number of other credit offers for startups, students, and occasionally they have other promotions, too. Search around to see what’s currently available.

Once you have a subscription, you need to create an instance of the Sentinel service. This is a straight-forward process documented in detail here; at a high level you:

  1. Decide in which region (Azure datacenter) you want to host your resources. There are a few considerations when choosing a region:
    1. Location – you may want to chose a location close to you to reduce latency, or based on country if data sovereignty is important to you.
    2. Service Availability – not all services are available in every region. You’ll want to make sure the region supports at least Azure Sentinel, Azure Monitor, Log Analytics, and Azure Storage.
    3. Price – Some regions are more expensive than others for certain services, depending on capacity and other factors. For example, for Sentinel, West US 2 was less expensive than the West US region when I created my instance. The Azure pricing estimator can help you determine where you can get the most capacity for your buck.
  2. Create a Log Analytics Workspace. This is the log collection component of Azure Monitor, and the underlying data store for Sentinel.
  3. Proceed through the Sentinel wizard to create an instance. Select your workspace from step 2 during setup.

Next, you need to decide what types of events you want being sent to Sentinel. At the time of writing, there are 118 different Data Connectors in Sentinel, with more being added every month. A Data Connector is service code that runs in Azure that knows how to parse a specific type of log and merge the data into Sentinel. There are first-party data connectors for many Microsoft services, like Azure, M365, AAD, IIS, Windows Event Logs, etc., as well as third-party connectors for all kinds of products ranging from AV solutions to productivity suites. There are also generic connectors provided by Microsoft, such as the Syslog connector, that can ingest data from any device that outputs syslog-formatted data.

For my network, I decided I wanted to capture:

  • Network Device Events (devices joining the network, firewall events)
  • Windows Event Log data from my PCs
  • Sysmon events from my PCs for extra details about process execution and communication
  • Network flow data (to look for unusual connections)
  • Syslog logs from various IOT devices and servers
  • Azure events for the subscription running Sentinel
  • Web server logs from this website 🙂

I also wanted to integrate some of the free/open source threat intelligence feeds from a few sources so traffic on my network could be correlated with known-malicious destinations. Luckily Sentinel has data connectors that could handle all of these different sources – I just needed to to get the logs into Azure.

Once you have your desired list of logs, go to the Data connectors page in your Sentinel instance. Search for services you want to add to see if there are native connectors. If so, great! If not, see if the service can be monitored using a more generic connector – for example, via a Syslog parser, an event log parser, or using Sysmon. At worst, you may need to write a custom parser for a more obscure type of log. Forums such as techcommunity.microsoft.com, the Sentinel GitHub page, Reddit, or your vendor’s support forums are all good resources to figure out the best way to connect your specific type of log to Sentinel.

Within the data connectors, you’ll find that there are several different ways that logs get ingested into the Log Analytics workspace. The most straight forward logs to import are those from Microsoft online services, like AAD, Azure, or M365. Generally these can be connected by simply going to the service and pointing it’s logging feature at the Log Analytics instance. The specific data connector page for each service will detail the exact steps.

The next easiest type of log to import are Windows host logs, such as Windows Events. To ingest these, download the Microsoft Monitoring Agent (MMA) package (the data connector page has a link) and install it on any host with logs you want. During the installation wizard it will ask if you want to forward logs to Azure. Say yes, and then enter the ID of your log analytics workspace and the workspace access key string. MMA client actually retrieves its configuration from Azure itself, so you select the log types and event severities you want within the Log Analytics workspace and your agents will begin forwarding the logs you requested.

The third type of log ingestion you’re likely to see is forwarded through a Linux host using the OMS Agent. This is similar to MMA, however you can run multiple instances on a single Linux host, with each agent configured to listen on a different port for a specific type of log. OMS Agent then forwards these events into Log Analytics. This is how the collection for Apache and Ubiquiti logging works.

In my network I set up a Linux VM and configured it with OMS to forward the logs from my Ubiquiti gear into the Ubiquiti data connector, syslogs from various other network devices (and the Linux VM itself), and my web server logs into my Log Analytics workspace. Then, on my Windows hosts, I installed MMA to gather event logs.

At this point I had decent coverage for events on my network, but I was still missing some details I wanted to capture. For one, the standard Windows Event logs don’t capture the level of detail you need to really investigate security incidents. This is where Sysmon logging comes in. Sysmon is a highly configurable logging utility developed by Mark Russinovich and Thomas Garnier as part of the SysInternals suite.

Configuring Sysmon can be intimidating. You need to create an XML file that defines all the different types of events to capture, and specifies events to ignore. For example, your backup utility probably looks an awful lot like malware trying to exfiltrate all of your documents or ransomware touching every file on disk. Luckily experts have already released sample Sysmon configs that make for a great starting point. Twitter’s SwiftOnSecurity has a popular example at https://github.com/SwiftOnSecurity/sysmon-config. Another good option is from Blue Team Labs: https://github.com/BlueTeamLabs/sentinel-attack. With Sysmon deployed, my Windows devices were reporting the crucial events I’d need if investigating a security incident.

This left one final datatype on my LAN to collect – net flows. While the Ubiquiti logging captures events such as devices joining the wireless network and firewall events, it does not log all the connection details I’d like. As someone who professionally spends a good deal of time looking for devices with weak security posture that can be used to pivot, I know that collecting this data is very important, and may be the best way to identify certain classes of threats.

Gathering this data requires having some way to tap into network traffic as it traverses the network. One way to do this is to get a LAN tap device and install it between your switch and router. Instead, I prefer to set up a mirror port on my core switch. There are a number of ways to capture this flood of traffic. For a while I fed this data into Security Onion, but was never completely satisfied with the experience. However I saw a talk hosted by SANS about a year ago from the Corelight team. Corelight makes hardware sensors that can capture this data, process it with Zeek and Suricata, and forward it to your logging platform of choice.

An enterprise Corelight sensor is beyond the budget, size, and scope of a home lab, but the Corelight team recently released a new solution: Corelight@Home (C@H). This is a free-for-personal-use Corelight image that runs on a Raspberry Pi. It doesn’t have the nice UI or all the filters and options of an enterprise Corelight sensor, but it is perfectly capable for monitoring a home lab. Sentinel already has a Corelight connector, which is compatible with the logs C@H sends.

For my C@H sensor, I got a Raspberry Pi 4, a 64 GB SD card, and a 1Gbps USB3 NIC, as well as a PoE hat so I can power the Pi using my switch. The second network connection is needed, as one NIC will be on the mirror port where it won’t be able to send – only listen. You can use the built-in WiFi for this, but I prefer a hardwired connection. With the hardware set up, I signed up for the C@H program and got links to the image file, license key, and PDF guide shortly thereafter. They also provided an invite to a Slack channel where users can ask questions and get support.

I realized that the C@H documentation assumes most people will be using Humio for their log collection, and it didn’t cover configuring C@H for Sentinel. Luckily this wasn’t hard to set up. First, I installed Sentinel’s Corelight data connector OMS agent on my Linux VM. Then I ran the setup script on my Pi and opted to not to configure an exporter during setup. Once setup was complete, I opened the config file at /etc/corelight-softsensor.conf and changed two lines:

Corelight::json_enable       T
Corelight::json_server       (Linux VM IP):21234

This enables the forwarding of events in JSON format to my OMS Corelight listener agent on the VM. I then restarted the sensor by running sudo systemctl restart corelight-softsensor. Within a couple of minutes Corelight events began showing up in Sentinel.

With my LAN covered, it was time to take care of my external services. This website is hosted on a Linux VM running Apache, so it was easy to enable the Apache data collector in Sentinel and then install the agent on the VM and point it at the Apache log path. After that, I enabled collectors for Azure itself, and forwarded my subscription logs to it.

That’s it! In just a few hours I had coverage of all the critical elements on my network. While I don’t have a lot of experience with other SIEMs, I was really impressed with Sentinel that it was this fast to go from beginner to successful deployment. It was certainly a lot better experience than the free options I had tried in the past.