
If you didn’t have a chance to see my talk on master key attacks at last year’s Layer 8 conference, it’s now available for viewing on YouTube. Enjoy!
Repinning an American 1305
For the past six months, I’ve been focused on a project I hope to share with everyone very soon. In the meantime I took a break a couple of days ago to work on building a progressive set of American 1305 locks – removing 1, 2, and 3 pins from these 5-pin locks. This set makes a great practice set for locksport folks – especially those who aren’t comfortable picking American locks and overcoming the strong spring tension needed to release the shackle. I decided to document this process on video – my first locksport-related YouTube video. Enjoy! Hopefully we’ll start having in-person meetups again soon and people can try picking these.
SANS Keynote Recording Available
My SANS keynote talk on cloud red teaming has been shared on YouTube here. I’ve also posted the slides for it here. Enjoy!
Master Key Attacks Talk at Layer 8
Today I’ll be giving an updated talk on attacks against master keyed systems at the TOOOL virtual Lock Pick Village at the Layer 8 Conference at 10 AM Pacific/1 PM Eastern. I hope you’ll be able to attend!
SANS Cloud Summit Keynote
If you are interested in cloud security, take a look at the 2020 SANS Cloud Summit coming up at the end of May. In addition to some greats SANS courses, like 545, they are also hosting a virtual CTF and have a series of speakers to kick off the event. I’ll be giving a keynote on red team assessments in the cloud. I hope you can join us!
New Impressioning Meetup
Join us Sunday, March 8 at 1:00 PM at Black Lodge Research in Redmond, WA for Seattle Locksport‘s first lock impressioning meetup. All experience levels welcome! We’ll have all the gear, locks, and key blanks you need. We’ll be meeting every 2nd Sunday of the month to practice, teach, learn, and socialize.
Curious about impressioning? Check out this overview from DEFCON, or see world champ Jos Weyers open a lock in under 2 minutes!
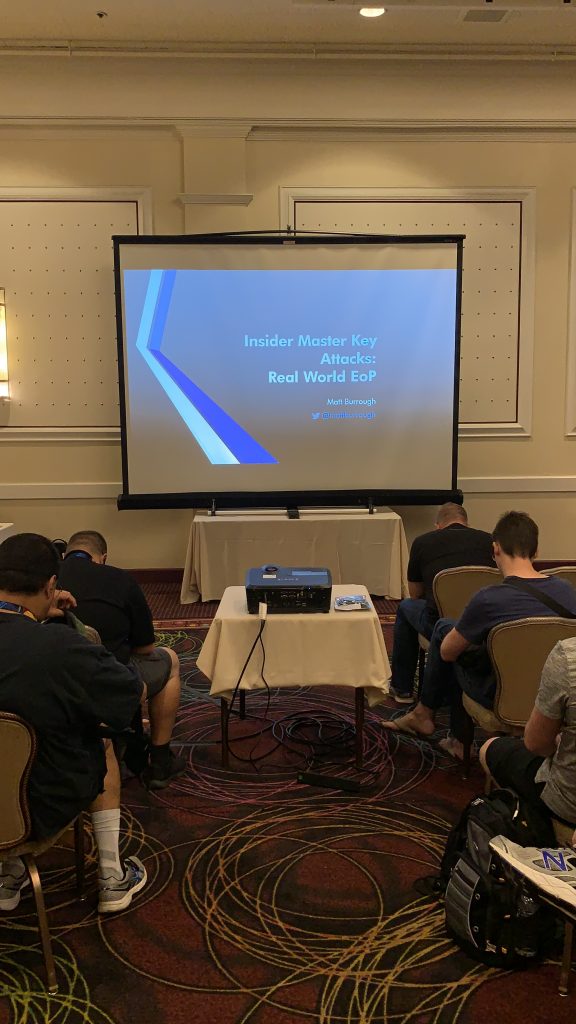
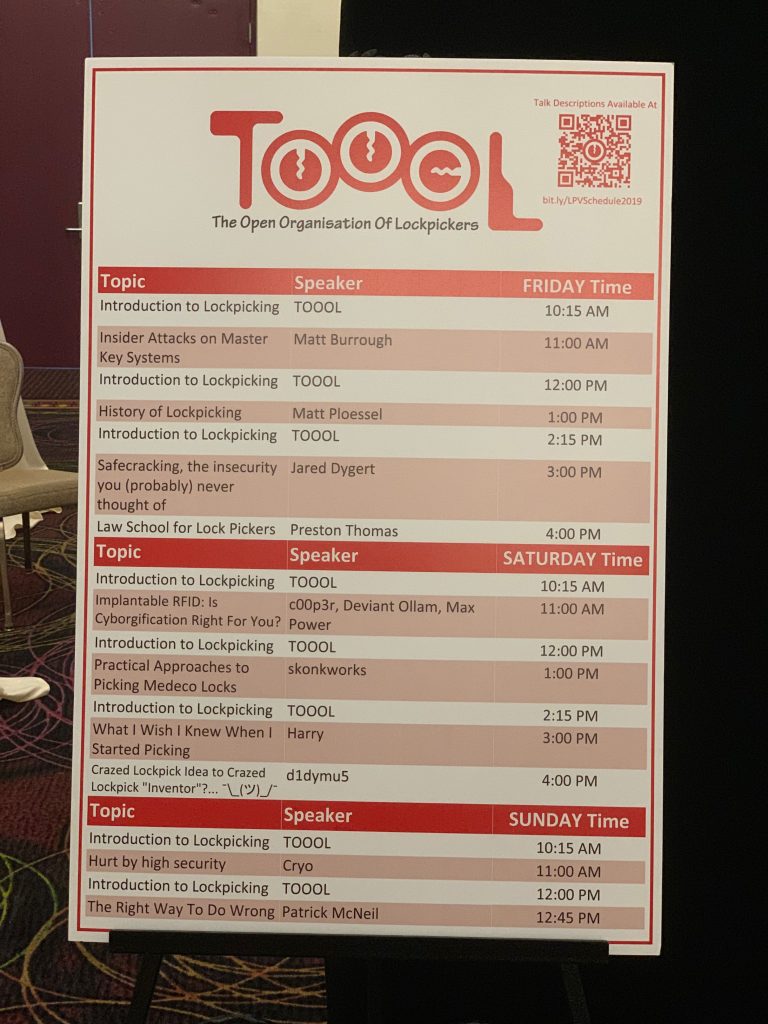
DEF CON 27 Talk: Master Key Insider Attacks
Earlier this month, I spoke at DEF CON 27’s Lock Pick Village on insider attacks that can be executed on master-keyed systems. (Note: Not Master brand locks. 😊) A copy of my slides can be downloaded from: https://burrough.org/papers/Burrough-DC27_Master_Key_Talk.pdf.
Abstract
As a lock enthusiast and professional pentester, I think a lot about ways to quickly or reliably gain access to restricted areas without relying on my picks. This talk will cover several ways to perform escalation of privilege in the physical world.
Pentesting Azure Apps in another Humble Bundle
If you missed the first Humble Bundle, my book is now available in No Starch Press’ “Hacking 2.0” bundle: https://www.humblebundle.com/books/hacking-no-starch-press-books. Pay $8 or more and get my eBook, along with several other great tiles, and you’ll also support great charities like the EFF. Just be quick – the bundle is only available for 12 more days.
SANS Holiday Hack Challenge Recognition
Ed & his team at CounterHack/SANS announced the winners of the 2018 SANS Holiday Hack Challenge this week. While I didn’t win, my report did get an honorable mention! Not bad for my first year playing. If you’d like to see my entry, you can download it here.
Thanks to SANS for hosting this event.

My Solution for SANS Holiday Hack Challenge
Late last year I decided to spend some time during the holidays to work on the SANS Holiday Hack Challenge. I’ve looked at a few of their challenges in the past, but never during the actual competition period, and never going through an entire year’s challenge. I’m very happy I did. Ed & team put together an awesome narrative, full of a variety of infosec-related puzzles, covering everything from web pentesting to forensics. Now that the competition is over, I thought I’d share a copy of my solution, in case anyone wants to compare; I’m sure everyone’s process was a bit different, and it is great to have several ideas of how to solve a problem.
My write-up is themed as a pentest report, since that’s the format I am most comfortable with. I hope you enjoy it. You can download it here.