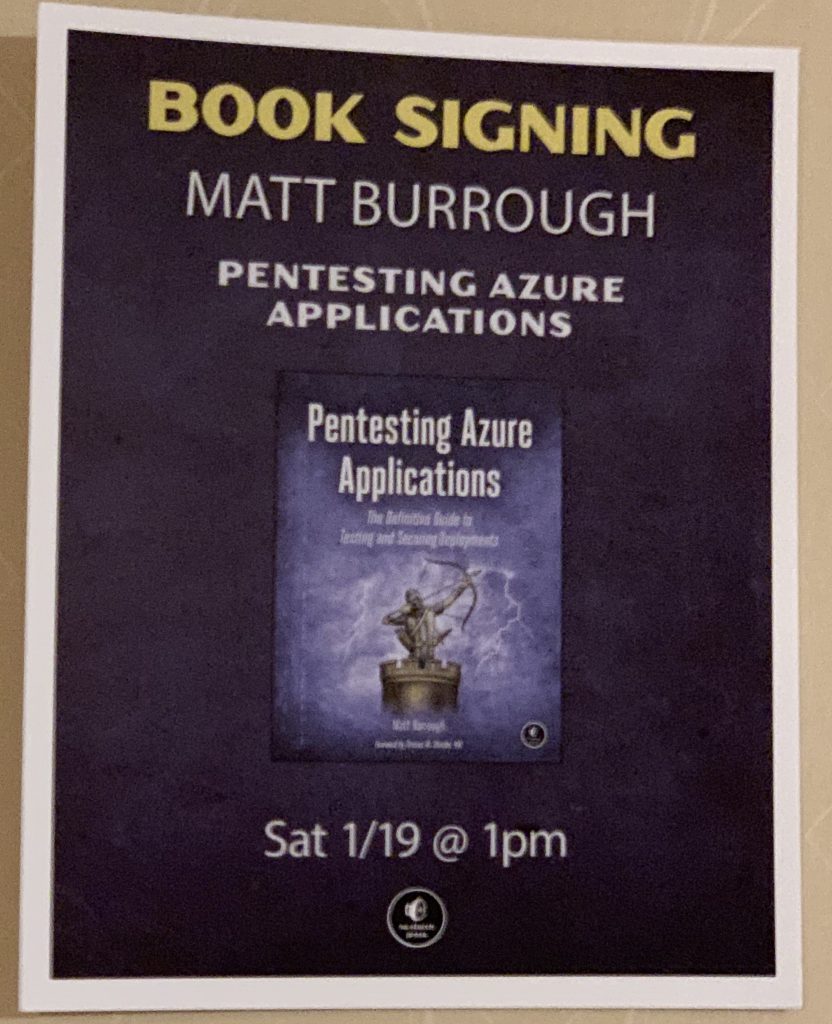
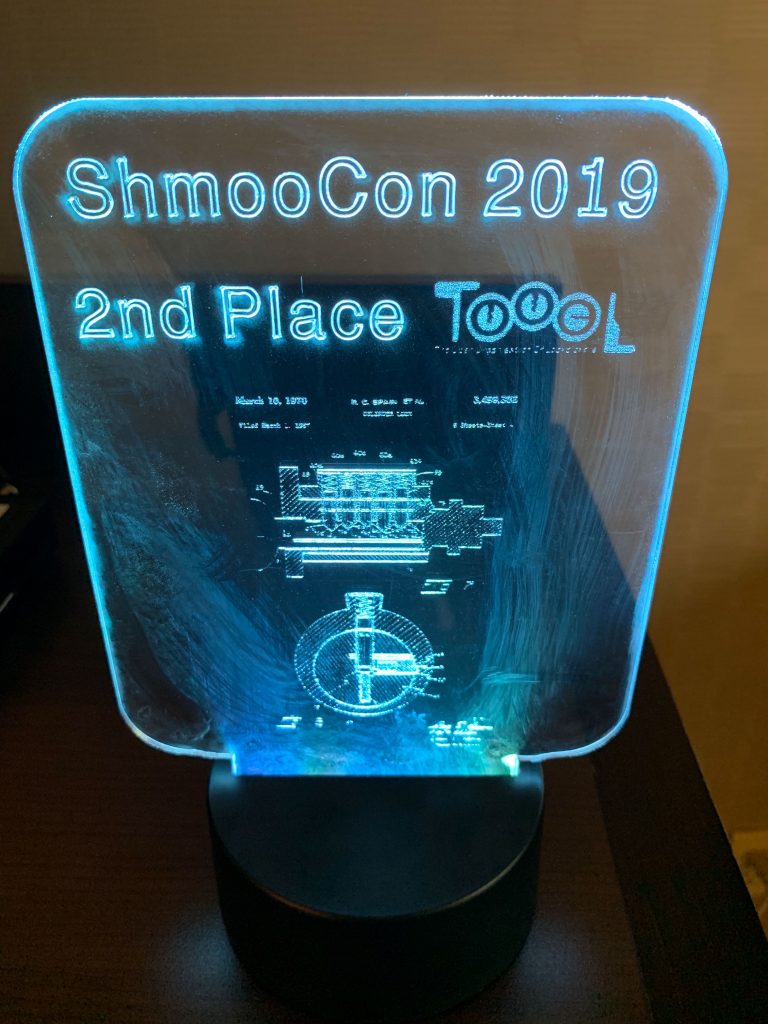
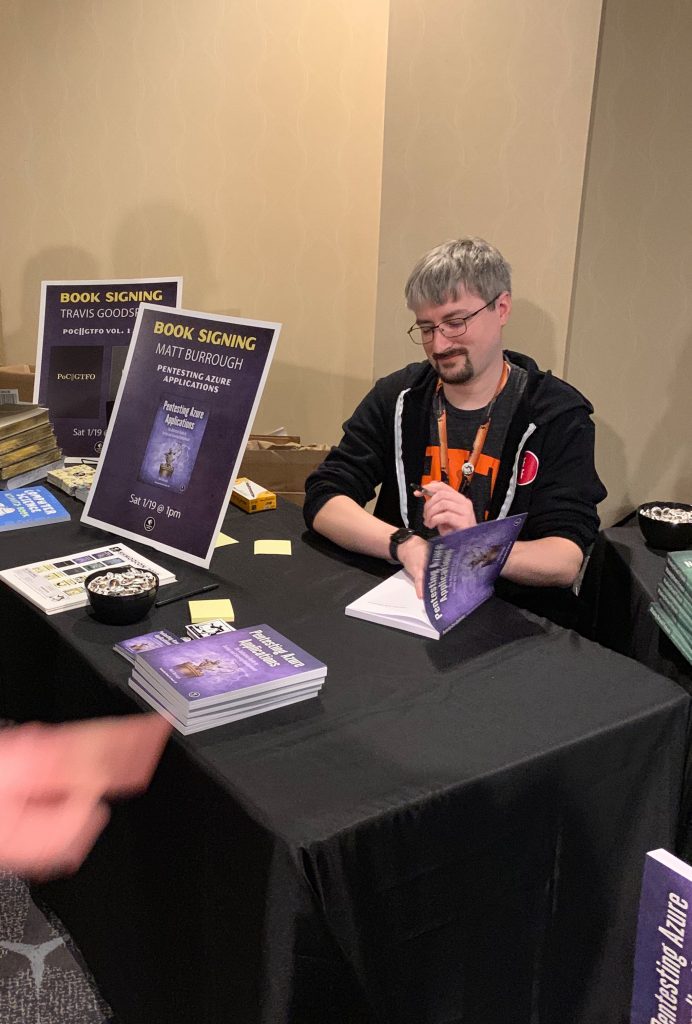
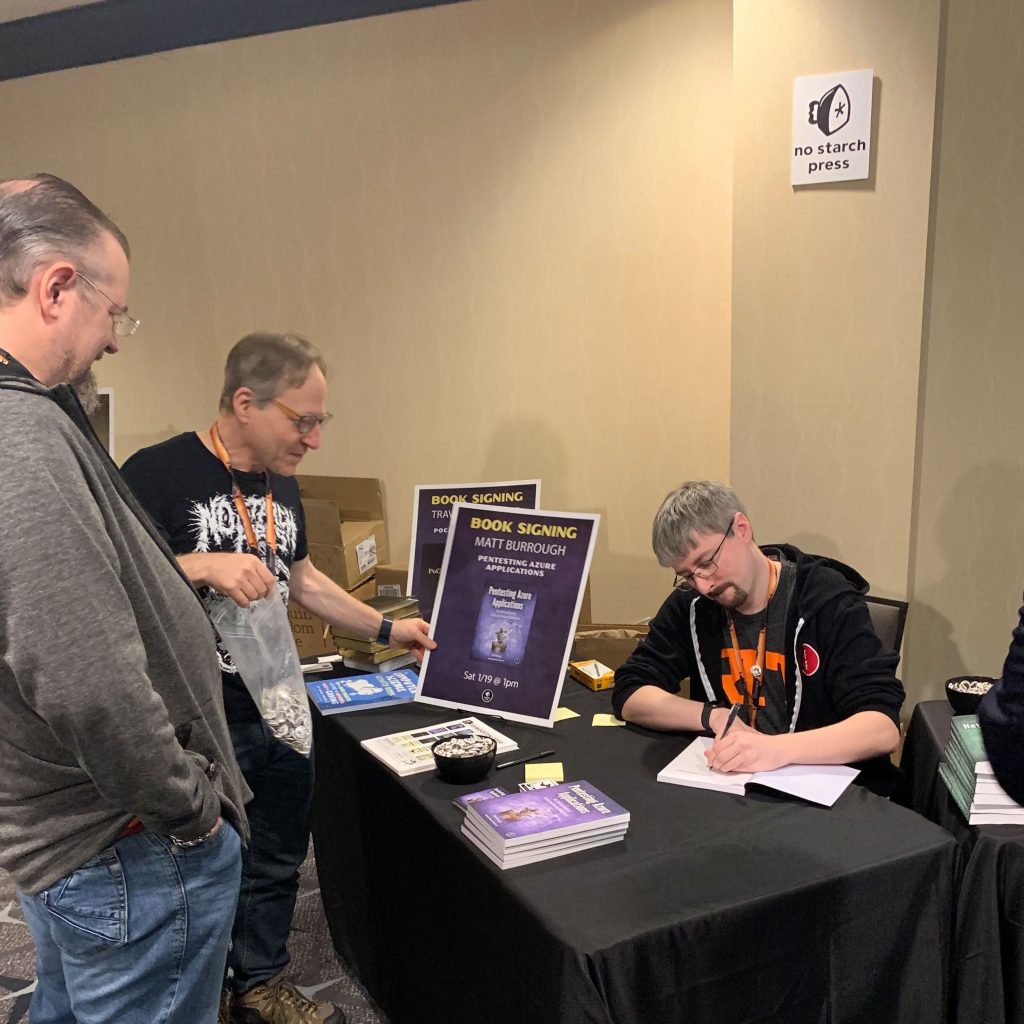
I had a lot of fun meeting many folks, catching up with old friends, and hearing some great talks at ShmooCon. I was fortunate to not only get to do a book signing at the No Starch Press booth, but also take home the second place trophy from the TOOOL DC Locksport Village! Thanks to everyone who came to the signing, or who stopped me just to say hello. I hope to see you all again soon.
Exciting news! My book, Pentesting Azure Applications, is in the No Starch Hacking for the Holidays Humble Bundle! For the next two weeks, a donation of $15 or more will support the EFF and get you a collection of No Starch’s security titles. Check it out!
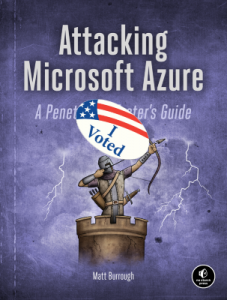
Are you excited to vote on Tuesday? To sweeten the deal, I’ll be giving away a signed copy of my book, Pentesting Azure Applications, to someone who votes! Just send me a photo showing you voted (selfie in line, “I voted” sticker, WA ballot stub, etc.) by Wednesday, 5 PM PST. I’ll randomly pick a winner. You can send it to me on Twitter @mattburrough or by email matt {at} (my last name) .org.
I will be speaking next week at the 2018 Seattle Cloud Security Alliance Conference “Securing the Digital Horizon @ Cloud City”. My talk is Best Practices for Securing Cloud Deployments, where I will be discussing some key threat vectors against cloud deployments, and the various ways you can mitigate the risks.
The conference is in Bellevue on September 21st. More information and registration is available at csaseattlechapter.org.
I just got notification that my book, Pentesting Azure Applications, is scheduled for delivery! Order now and be one of the first to get a copy! I hope everyone finds it informative, entertaining, and well written.
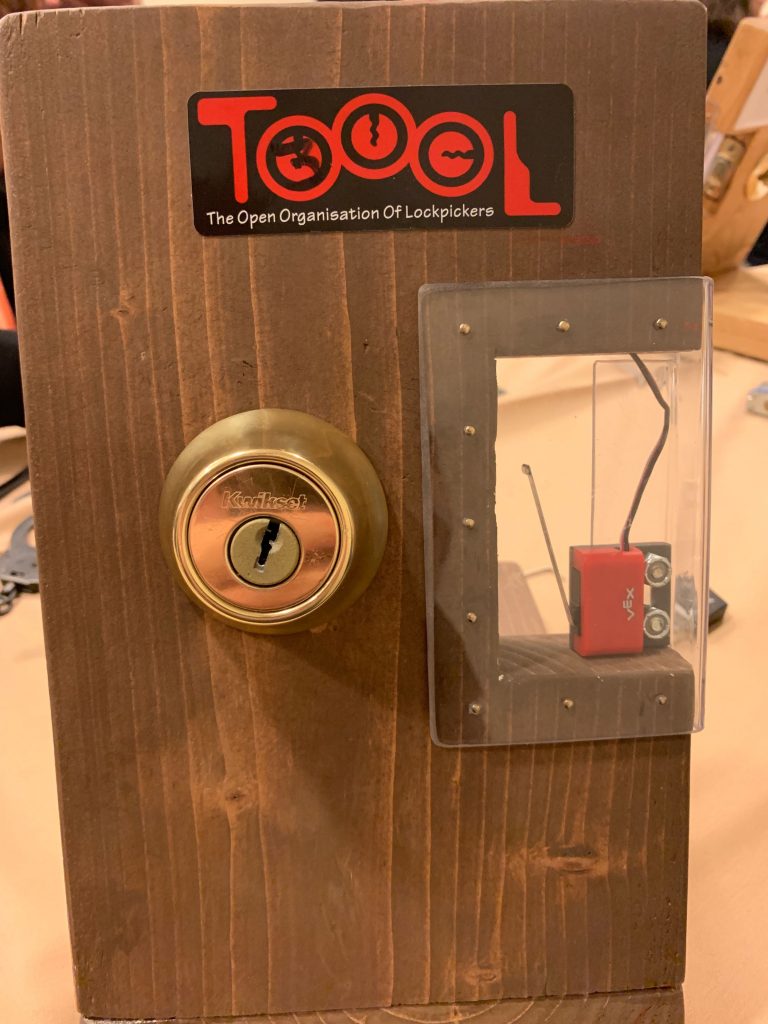
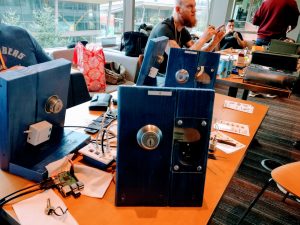
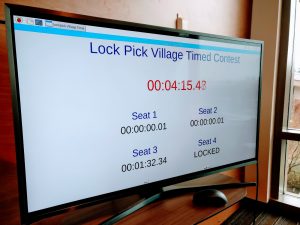
I recently built a timed lock picking competition, based on a similar design created by @dossman33. It consists of four deadbolts (plus two spares), all pinned identically, that, when opened, trigger a switch wired to a Raspberry Pi. The Pi has a UI written in Python that shows the current elapsed time, plus the time that each station opened. I’ve shared the code at https://github.com/mburrough/locktimer.
As both a locksport enthusiast and a professional red teamer, I spend a good deal of time thinking about locks. One fascinating subset of locks is master keyed systems. These are primarily used by large businesses to create a hierarchy of locks and keys: individuals can have a key that works for the building front door and their own offices, managers can have keys that work on any of their subordinates’ offices, janitors can have keys to their assigned floors’ offices, while security guards and maintenance can have keys to any room.
Depending on how these systems are implemented, they may suffer from an inherent weakness. Often, the bitting (key cuts) used for the top master key (e.g. the one used by security) cannot be used in any individual user key. For example, if the top master key code is 6-3-4-2-2, a valid user key may be 4-1-6-4-5, but could not be 4-1-6-2-5. This means that given the codes for enough user keys, an attacker could eliminate most/all possibilities except for the master key bitting, thereby decoding the master key.
This may sound like it would take a large number of keys to find the master (especially for keys with 6 or 7 cuts and 7+ possible cut depths per position), there is another feature of many key systems that helps narrow the space: MACS. MACS are the Maximum Adjacent Cut Specification for a given brand/model. These are standards that say a key cannot go from a very small cut in one position to a very large cut in the next position, as the key could be too weak and might break off in a lock (or pocket, or purse).
Similar to MACS, some systems also restrict user keys from being within a certain offset (e.g. +/- 1) of the master. In such a system, 4-1-6-1-5 might also be invalid with the above example master key.
For this kind of attack, the attacker would either need to covertly view users’ keys and eliminate cuts, or work with insider co-conspirators to view their keys. But would the number of keys needed to be viewed be feasible? To answer this, I created a computer model that simulates the attack and displays the number of keys needed for that attack. Simply input the specifications for the key system in question, plus the number of runs desired for the model, and it will display the average, minimum, and maximum number of keys needed across the test executions.
I’m excited to announce my first book, PenTesting Azure Applications, is available for preorder from Amazon and No Starch’s site. This title aims to provide a reference guide for security professionals looking to assess cloud deployments. It offers practical advice for how to properly lock down subscriptions and their services, and make use of Azure’s monitoring and security features.
This is an archive post of content I wrote for the NTDebugging Blog on MSDN. Since the MSDN blogs are being retired, I’m transferring my posts here so they aren’t lost. The post has been back-dated to its original publication date.
Recently, I was contacted by a customer who was advised by an ISV to set a registry value under one of the sub keys in HKEY_LOCAL_MACHINE\SYSTEM\CurrentControlSet\Control\Session Manager. Let’s call it UseQuantumComputing = 1 (value name has been changed to protect the ISV). The customer wanted to know what this value actually did and no one could find any documentation explaining it. These issues often come to our team because we have access to the Windows source code. I did a bit of code review to find out what this value does. As it turns out, nowhere in Windows source code between Windows 2000 and Windows Server 2012 do we ever check for or set UseQuantumComputing.
I can think of a few reasons the ISV would suggest setting this value. Perhaps they were under the impression this did something but got confused about the value name. It’s possible they hoped making a registry change would have a placebo effect. Or, perhaps their software actually checks this value, not Windows.
The latter of these possibilities is probably the worst case scenario. An ISV should not create a registry value inside of keys used for Windows’ own internal use. Why? The first reason is that there’s no guarantee that Microsoft won’t end up coincidentally using that same value name later. This would cause a conflict between the two users of the value. Second, we have to consider the scenario where two different ISVs both decide to use the same value. That would be bad too. Lastly, there’s no guarantee that the key in use will still exist in later versions, or that it will be writable or readable by the ISV due to permission changes. In addition to all these reasons, there is the common sense issue that it is just confusing. Now the ISV’s software and uninstaller needs to look all over the registry, not just in their own keys.
On a similar note, I also recently had a case where a “Windows Tips” blog (not created, endorsed, or run by Microsoft) suggested using a registry value that was implemented in Windows but was not documented by Microsoft. It turns out this value wasn’t thoroughly tested (because it was undocumented and wasn’t intended to be used in production), and using it would cause server hangs under certain conditions. These hangs were only discovered after a large customer decided to implement the undocumented value across their enterprise.
Here are a few tips for IT Pros, developers, and users alike:
Don’t implement random registry settings if you can’t find documentation for that setting on an official Microsoft site, like MSDN, TechNet, or support.microsoft.com(information on forums or answer boards (e.g. social.*.microsoft.com or answers.*.microsoft.com) is not official documentation). At best these unknown registry settings they will do nothing, at worst they will cause you headaches later.
If a key/value isn’t documented, changes to it likely are not tested, and could put your machine in a state that makes it difficult or impossible to support.
If you are a developer, keep any of your registry settings in your own key. Don’t pollute in others’ keys.
If an ISV or Microsoft suggests you implement a setting, make sure you understand the implications of that setting.
I’ll leave you with the warning displayed in many of our KBs – it’s there for a reason!
“WARNING: If you use Registry Editor incorrectly, you may cause serious problems that may require you to reinstall your operating system. Microsoft cannot guarantee that you can solve problems that result from using Registry Editor incorrectly. Use Registry Editor at your own risk.”
This is an archive post of content I wrote for the NTDebugging Blog on MSDN. Since the MSDN blogs are being retired, I’m transferring my posts here so they aren’t lost. The post has been back-dated to its original publication date.
What is a bug check 0x133?
Starting in Windows Server 2012, a DPC watchdog timer is enabled which will bug check a system if too much time is spent in DPC routines. This bug check was added to help identify drivers that are deadlocked or misbehaving. The bug check is of type “DPC_WATCHDOG_VIOLATION” and has a code of 0x133. (Windows 7 also included a DPC watchdog but by default, it only took action when a kernel debugger was attached to the system.) A description of DPC routines can be found at http://msdn.microsoft.com/en-us/library/windows/hardware/ff544084(v=vs.85).aspx.
The DPC_WATCHDOG_VIOLATION bug check can be triggered in two ways. First, if a single DPC exceeds a specified number of ticks, the system will stop with 0x133 with parameter 1 of the bug check set to 0. In this case, the system’s time limit for single DPC will be in parameter 3, with the number of ticks taken by this DPC in parameter 2. Alternatively, if the system exceeds a larger timeout of time spent cumulatively in all DPCs since the IRQL was raised to DPC level, the system will stop with a 0x133 with parameter 1 set to 1. Microsoft recommends that DPCs should not run longer than 100 microseconds and ISRs should not run longer than 25 microseconds, however the actual timeout values on the system are set much higher.
How to debug a 0x133 (0, …
In the case of a stop 0x133 with the first parameter set to 0, the call stack should contain the offending driver. For example, here is a debug of a 0x133 (0,…) kernel dump:
Per MSDN, we know that this DPC has run for 0x283 ticks, when the limit was 0x282.
0: kd> k

Child-SP          RetAddr           Call Site

fffff803`08c18428 fffff803`098525df nt!KeBugCheckEx
fffff803`08c18430 fffff803`09723f11 nt! ??::FNODOBFM::`string'+0x13ba4
fffff803`08c184b0 fffff803`09724d98 nt!KeUpdateRunTime+0x51
fffff803`08c184e0 fffff803`09634eba nt!KeUpdateTime+0x3f9
fffff803`08c186d0 fffff803`096f24ae hal!HalpTimerClockInterrupt+0x86
fffff803`08c18700 fffff803`0963dba2 nt!KiInterruptDispatchLBControl+0x1ce
fffff803`08c18898 fffff803`096300d0 hal!HalpTscQueryCounter+0x2
fffff803`08c188a0 fffff880`04be3409 hal!HalpTimerStallExecutionProcessor+0x131
fffff803`08c18930 fffff880`011202ee ECHO!EchoEvtTimerFunc+0x7d  //Here is our driver, and we can see it calls into StallExecutionProcessor
fffff803`08c18960 fffff803`097258b4 Wdf01000!FxTimer::TimerHandler+0x92
fffff803`08c189a0 fffff803`09725ed5 nt!KiProcessExpiredTimerList+0x214
fffff803`08c18ae0 fffff803`09725d88 nt!KiExpireTimerTable+0xa9
fffff803`08c18b80 fffff803`0971fe76 nt!KiTimerExpiration+0xc8
fffff803`08c18c30 fffff803`0972457a nt!KiRetireDpcList+0x1f6
fffff803`08c18da0 00000000`00000000 nt!KiIdleLoop+0x5a
Let’s view the driver’s unassembled DPC routine and see what it is doing:
0: kd> ub fffff880`04be3409
ECHO!EchoEvtTimerFunc+0x54:
fffff880`04be33e0 448b4320        mov     r8d,dword ptr[rbx+20h]
fffff880`04be33e4 488b0d6d2a0000  mov     rcx,qword ptr [ECHO!WdfDriverGlobals (fffff880`04be5e58)]
fffff880`04be33eb 4883631800      and     qword ptr [rbx+18h],0
fffff880`04be33f0 488bd7          mov     rdx,rdi
fffff880`04be33f3 ff150f260000    call    qword ptr [ECHO!WdfFunctions+0x838(fffff880`04be5a08)]
fffff880`04be33f9 bbc0d40100      mov     ebx,1D4C0h
fffff880`04be33fe b964000000      mov     ecx,64h
fffff880`04be3403 ff15f70b0000    call    qword ptr[ECHO!_imp_KeStallExecutionProcessor (fffff880`04be4000)]   //It's calling KeStallExecutionProcessor with 0x64 (decimal 100) as a parameter

0: kd> u fffff880`04be3409
ECHO!EchoEvtTimerFunc+0x7d:
fffff880`04be3409 4883eb01        sub     rbx,1
fffff880`04be340d 75ef            jne     ECHO!EchoEvtTimerFunc+0x72 (fffff880`04be33fe)     //Here we can see it is jumping back to call KeStallExecutionProcessor in a loop
fffff880`04be340f 488b5c2430      mov     rbx,qword ptr[rsp+30h]
fffff880`04be3414 4883c420        add     rsp,20h
fffff880`04be3418 5f              pop     rdi
fffff880`04be3419 c3              ret
fffff880`04be341a cc              int     3
fffff880`04be341b cc              int     3

0: kd> !pcr
KPCR for Processor 0 at fffff80309974000:
    Major 1 Minor 1
      NtTib.ExceptionList: fffff80308c11000
          NtTib.StackBase: fffff80308c12080
         NtTib.StackLimit: 000000d70c7bf988
       NtTib.SubSystemTib: fffff80309974000
            NtTib.Version: 0000000009974180
        NtTib.UserPointer: fffff803099747f0
            NtTib.SelfTib: 000007f7ab80c000

                  SelfPcr: 0000000000000000
                     Prcb: fffff80309974180
                     Irql: 0000000000000000
                      IRR: 0000000000000000
                      IDR: 0000000000000000
            InterruptMode: 0000000000000000
                      IDT: 0000000000000000
                      GDT: 0000000000000000
                      TSS: 0000000000000000

            CurrentThread: fffff803099ce880
               NextThread: fffffa800261cb00
               IdleThread: fffff803099ce880

                DpcQueue:  0xfffffa80020ce790 0xfffff880012e4e9c [Normal] NDIS!NdisReturnNetBufferLists
                           0xfffffa800185f118 0xfffff88000c0ca00 [Normal] ataport!AtaPortInitialize
                           0xfffff8030994fda0 0xfffff8030972bc30 [Normal] nt!KiBalanceSetManagerDeferredRoutine
                           0xfffffa8001dbc118 0xfffff88000c0ca00 [Normal] ataport!AtaPortInitialize
                           0xfffffa8002082300 0xfffff88001701df0 [Normal] USBPORT
The !pcr output shows us queued DPCs for this processor. If you want to see more information about DPCs and the DPC Watchdog, you could dump the PRCB listed in the !pcr output like this:
dt nt!_KPRCB fffff80309974180 Dpc*
Often the driver will be calling into a function like KeStallExecutionProcessor in a loop, as in our example debug. To resolve this problem, contact the driver vendor to request an updated driver version that spends less time in its DPC Routine.
How to troubleshoot a 0x133 (1, …
Determining the cause of a stop 0x133 with a first parameter of 1 is a bit more difficult because the problem is a result of DPCs running from multiple drivers, so the call stack is insufficient to determine the culprit. To troubleshoot this stop, first make sure that the NT Kernel Logger or Circular Kernel Context Logger ETW traces are enabled on the system. (For directions on setting this up, see http://blogs.msdn.com/b/ntdebugging/archive/2009/12/11/test.aspx.)
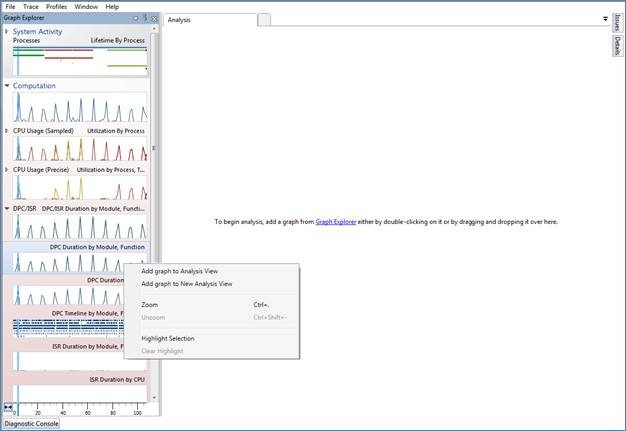
Once the logging is enabled and the system bug checks, dump out the list of ETW loggers using !wmitrace.strdump. Find the ID of the NT Kernel logger or the Circular logger. You can then use !wmitrace.logsave (ID) (path to ETL) to write out the ETL log to a file. Load it up with Windows Performance Analyzer and add the DPC or DPC/ISR Duration by Module, Function view (located in the Computation group) to your current analysis window:
WPA DPC Graph
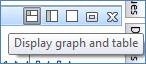
Next, make sure the table is also shown by clicking the box in the upper right of the view:
Enable Graph and Table view in WPA
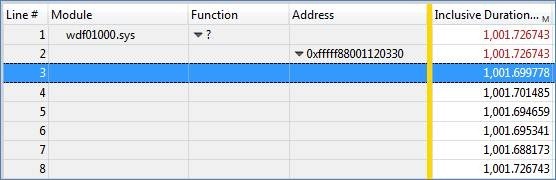
Ensure that the Address column is added on the left of the gold bar, then expand each address entry to see individual DPC enters/exits for each function. Using this data, you can determine which DPC routines took the longest by looking at the inclusive duration column, which should be added to the right of the gold bar:
DPC Duration
In this case, these DPCs took 1 second, which is well over the recommended maximum of 100 us. The module column (and possible the function column, if you have symbols) will show which driver is responsible for that DPC routine. Since our ECHO driver was based on WDF, that is the module named here.