
This is an archive post of content I wrote for the NTDebugging Blog on MSDN. Since the MSDN blogs are being retired, I’m transferring my posts here so they aren’t lost. The post has been back-dated to its original publication date.
Recently I received a debug request for a customer having problems running large executables. On their systems, they could run most EXEs without any problems, but they had two programs that were over 1.8 GB which, when run, would display the following error:
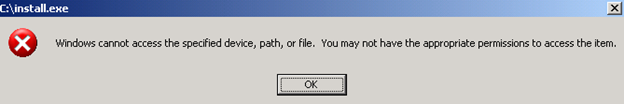
If they tried to run them in a command prompt, they received the message “Access is denied.” Both attempts were made with an administrator account and in neither case were the processes created. Through testing, they found that the programs worked if they were scheduled to run as System and also worked when run in safe mode as an administrator.
When the case was brought to my attention, it was noted that when the failing executables were run, the following appeared in process monitor logs:

The engineer did not see this when one of the problematic EXEs was run (successfully) on his test machine. The customer provided a VM image of their system which we set up in HyperV with a named pipe kernel debugger. I then started kernel debugging to find the cause of the INVALID PARAMETER error, hoping that resolving it would fix the issue.
To start, I looked at the call stack within process monitor for the invalid parameter:
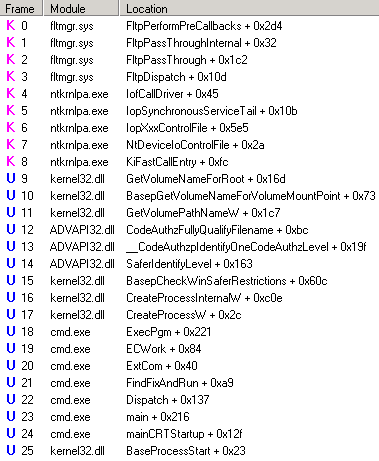
The problem is this isn’t exactly where we return invalid parameter. Looking at the source code for Fltmgr, it doesn’t return invalid parameter – this was just where the error was caught in procmon. This call stack did provide some ideas for good starting places to debug, however. First, I looked up the hex value for STATUS_INVALID_PARAMETER in ntstatus.h – 0xC000000D. Knowing this, I decided to set a breakpoint on nt!IofCallDriver and ran the program. Once the debugger broke in, I planned to use wt -oR. This will trace through the calls displaying the return values next to each call. From there, I would just need to find 0xc000000d on the return column. Unfortunately, I had forgotten was wt does not display return codes in kernel debugging, only when debugging user mode.
With wt not an option, I decided to use a combination of debugger commands to approximate the output of wt. I knew the return value I was looking for, and I was also confident that I would find that code in the EAX register after the problem occurred. As such, I needed to write a loop that would walk through the instructions until it found 0xC000000D in EAX. The debugger provides two main options for walking instructions: p and t. p (Step) will execute a single instruction and display the register values. If the instruction is a call, it will not enter that function, but just display the results after that subroutine has been executed. t (Trace) also executes a single instruction, but it will enter into the function and will display each instruction.
In this case I wanted trace so I could see which function was returning the invalid parameter status. Tracing though that many instructions/functions would take a long time, but there are some variations on t (and p) that can help. tc (or pc)will execute instructions until a call statement is reached, where it will break and show the register values. tt (or pt) will execute instructions until a return instruction is reached. tct (or pct) will run until either a call or return is reached. In this case, I opted for tct.
Knowing that I would use tct, I had to find a way to execute tct statements until EAX was the value I was looking for. This can be accomplished with the z (While) debugger command. The syntax is pretty easy, it’s just z(expression) and it works just like a do-while loop. Putting it all together, I used this command in the debugger:
tct; z(eax!=0xc000000d)I then waited for the debugger to break in so I could see where this status was being thrown. Regrettably, the code called ended up going in to some recursion which made my while loop take way too long. To resolve this, I set a new breakpoint just before we entered the recursion, reran the program, used p to step past the call then ran the tct loop.
This time I was quickly brought to the code I was looking for. As soon as it broke in, I ran k to view the callstack:
kd> k
ChildEBP RetAddr
b9541a3c f7b7fab9 Ntfs!NtfsCommonDeviceControl+0x40
b9541aa0 f7b8b02f Ntfs!NtfsFsdDispatchSwitch+0xe4
b9541bbc 8081df85 Ntfs!NtfsFsdDispatchWait+0x1c
b9541bd0 f7876d28 nt!IofCallDriver+0x45
b9541bfc 8081df85 fltmgr!FltpDispatch+0x152
b9541c10 f7876d28 nt!IofCallDriver+0x45
b9541c3c 8081df85 fltmgr!FltpDispatch+0x152
b9541c50 808f5437 nt!IofCallDriver+0x45
b9541c64 808f61bf nt!IopSynchronousServiceTail+0x10b
b9541d00 808eed08 nt!IopXxxControlFile+0x5e5
b9541d34 808897bc nt!NtDeviceIoControlFile+0x2a
b9541d34 7c82860c nt!KiFastCallEntry+0xfc
0012e960 7c826fe9 ntdll!KiFastSystemCallRet
0012e964 77e416f9 ntdll!NtDeviceIoControlFile+0xc
0012e9c8 77e6738d kernel32!DeviceIoControl+0x137
0012ec44 77e67032 kernel32!GetVolumeNameForRoot+0x16d
0012ec68 77e67782 kernel32!BasepGetVolumeNameForVolumeMountPoint+0x73
0012ecd0 7d20b01d kernel32!GetVolumePathNameW+0x1c7
0012ef18 7d20ae2c ADVAPI32!CodeAuthzFullyQualifyFilename+0xbc
0012eff8 7d20b33f ADVAPI32!__CodeAuthzpIdentifyOneCodeAuthzLevel+0x19f
0012f07c 77e6df9e ADVAPI32!SaferIdentifyLevel+0x163
0012f278 77e6ce03 kernel32!BasepCheckWinSaferRestrictions+0x60c
0012fa90 77e424b0 kernel32!CreateProcessInternalW+0xc0e
0012fac8 4ad0256f kernel32!CreateProcessW+0x2c
0012fc24 4ad01a2b cmd!ExecPgm+0x221
0012fc58 4ad019b3 cmd!ECWork+0x84
0012fc70 4ad03c58 cmd!ExtCom+0x40
0012fe9c 4ad01447 cmd!FindFixAndRun+0xa9
0012fee0 4ad0c30b cmd!Dispatch+0x137
0012ff44 4ad07786 cmd!main+0x216
0012ffc0 77e6f23b cmd!mainCRTStartup+0x12f
0012fff0 00000000 kernel32!BaseProcessStart+0x23
If we look at the assembly around Ntfs!NtfsCommonDeviceControl+0x40, we see that mov 0xC000000D in to esi, then mov esi to eax if our return from NtfsDecodeFileObject isn’t 4:
f7b7faf9 e8e904fdff      call    Ntfs!NtfsDecodeFileObject (f7b4ffe7)
f7b7fafe 83f804          cmp     eax,4
f7b7fb01 0f848873ffff    je      Ntfs!NtfsCommonDeviceControl+0x54 (f7b76e8f)

Ntfs!NtfsCommonDeviceControl+0x40:
f7b7fafe 83f804          cmp     eax,4
f7b7fb01 0f848873ffff    je      Ntfs!NtfsCommonDeviceControl+0x54 (f7b76e8f)
f7b7fb07 be0d0000c0      mov     esi,0C000000Dh
f7b7fb0c 56              push    esi
f7b7fb0d 53              push    ebx
f7b7fb0e 57              push    edi
f7b7fb0f e83506fdff      call    Ntfs!NtfsCompleteRequest (f7b50149)
f7b7fb14 8bc6            mov     eax,esi
I looked at the source code for these functions, and it didn’t make sense that a failure here would cause the problems we were seeing; especially specific to large executables. Out of curiosity I ran notepad on the VM while logging in perfmon and found that it too displayed INVALID PARAMETER, but the program stated and ran correctly:

Since this wasn’t the problem, I stopped reviewing the code and decided on a new approach. We knew that when running the EXE in a command prompt we received an Access is denied message. At that point it made sense to switch to user mode debugging and take a look at the cmd.exe process that was trying to launch install.exe.
Doing user mode debugging in a VM can be a bit of a challenge, especially if you are trying to minimize changes to the VM (and in my case, avoid putting any symbols on the customer’s VM image). Since I already had a kernel debugger attached, one option would be to run ntsd.exe (debugger provided in the Debugging Tools for Windows) on the VM with the -p switch specifying the PID of the cmd.exe process I wanted to debug and -d switch which forwards the i/o of ntsd to the kernel debugger. The problem with this approach is the kernel debugger just becomes a front end for issuing commands and seeing the output from ntsd. That means all symbol resolution is still done on the target system running ntsd.
I didn’t want give the customer VM Internet or corporate network access, so I instead opted to run dbgsrv.exe on the VM. Running “dbgsrv -t tcp:port=9999” tells the debug server to listen on TCP port 9999 for debugger connections. Then, on the HyperV server computer I could just run windbg -premote tcp:server=(IP of VM),port=9999 -p (PID of cmd on VM) to debug it.
I suspected that we may be calling CreateProcess but it was failing, so I set a breakpoint kernel32!CreateProcessW. Sure enough, it hit when I tried to run install.exe in the command prompt:
0:000> k
ChildEBP RetAddr
0012fac8 4ad0256f kernel32!CreateProcessW
0012fc24 4ad01a2b cmd!ExecPgm+0x221
0012fc58 4ad019b3 cmd!ECWork+0x84
0012fc70 4ad03c58 cmd!ExtCom+0x40
0012fe9c 4ad01447 cmd!FindFixAndRun+0xa9
0012fee0 4ad0c30b cmd!Dispatch+0x137
0012ff44 4ad07786 cmd!main+0x216
0012ffc0 77e6f23b cmd!mainCRTStartup+0x12f
0012fff0 00000000 kernel32!BaseProcessStart+0x23
This time I could use wt -oR since this was a usermode debug. Looking in ntstatus.h again, the code for STATUS_ACCESS_DENIED is 0xC0000022. Running wt can take a very long time, so I used the -l switch, which limits the number of levels deep it will display. This would be something like using tct as I did above until you were a few calls deep then using pct. Using wt -l 3 -oR gave me the following:
…
  575   291 [  1]   kernel32!CreateProcessInternalW
   35     0 [  2]     kernel32!BasepCheckWinSaferRestrictions
   25     0 [  3]       ntdll!RtlEnterCriticalSection eax = 0
   48    25 [  2]     kernel32!BasepCheckWinSaferRestrictions
    1     0 [  3]       ntdll!NtOpenThreadToken
    3     0 [  3]       ntdll!ZwOpenThreadToken eax = ffffffff`c000007c
   57    29 [  2]     kernel32!BasepCheckWinSaferRestrictions
    1     0 [  3]       ntdll!ZwOpenProcessToken
    3     0 [  3]       ntdll!NtOpenProcessToken eax = 0
  116    33 [  2]     kernel32!BasepCheckWinSaferRestrictions
  113     0 [  3]       ADVAPI32!SaferIdentifyLevel eax = 0
  130   146 [  2]     kernel32!BasepCheckWinSaferRestrictions
    4     0 [  3]       ntdll!ZwClose eax = 0
  132   150 [  2]     kernel32!BasepCheckWinSaferRestrictions
   22     0 [  3]       ntdll!RtlLeaveCriticalSection eax = 0
  138   172 [  2]     kernel32!BasepCheckWinSaferRestrictions
    5     0 [  3]       kernel32!__security_check_cookie eax = ffffffff`c0000022
…
Now we are getting close! I set a new breakpoint for kernel32!BasepCheckWinSaferRestrictions and reran the test. This gave me the following line:
63 0 [ 3] ADVAPI32!__CodeAuthzpCheckIdentityHashRules eax = ffffffff`c0000022One last run with a new breakpoint at ADVAPI32!__CodeAuthzpCheckIdentityHashRules and I found what I was looking for:
58 218 [ 1] ADVAPI32!__CodeAuthzpEnsureMapped eax = ffffffff`c0000022The depth is shown in brackets. As this call was 1 deep from __CodeAuthzpCheckIdentityHashRules and I was using 3 as my maximum depth in wt, I knew this is where the access denied was coming from. I reviewed the source code and found that this is the code that performs Software Restriction Policy checking. Specifically, we are attempting to map the executable into memory to perform hash checking on it. Since there isn’t 1.8 GB of contiguous available memory, it failed. Looking at the VM, I discovered that the customer had implemented a number of software restriction policies. As a test, I removed their restrictions on the VM, and the programs ran successfully. A search of the KB revealed that a hotfix was published for this problem: 973825. Installing the hotfix in the article also resolved the issue with their policies intact.
-Matt Burrough