
This is an archive post of content I wrote for the NTDebugging Blog on MSDN. Since the MSDN blogs are being retired, I’m transferring my posts here so they aren’t lost. The post has been back-dated to its original publication date.
Matt Burrough here again. On rare occasions when debugging, we’ll actually know (or strongly suspect) what the root cause of a problem is at the beginning of our analysis – but we still need to investigate to confirm our assertion. The following is a case study for an issue I worked on recently where the print spooler was hanging.
This customer had recently upgraded their print servers from Windows 2003 to Windows 2008 R2. After the upgrade, the spooler would frequently go unresponsive, and no jobs could be printed. Rebooting the server provided some relief, but the problem would reoccur as the jobs started coming in again.
One of my peers had completed an initial analysis of a user mode memory dump of the spooler process, and found that spooler seemed to be blocked waiting on PrintIsolationHost.exe. For those not familiar with recent changes to the print spooler’s design – Print Isolation Host was added in Windows 7/2008 R2 as a way to isolate print drivers from each other and from the spooler process so a crash in one driver doesn’t take down the entire printing environment. Given the large number of print drivers found on some print servers, this can be a great help for stability and availability of the spooler. See http://blogs.technet.com/b/askperf/archive/2009/10/08/windows-7-windows-server-2008-r2-print-driver-isolation.aspx if you would like more details on Print Isolation Host.
Unfortunately for my team mate, the data collected did not include dumps of Print Isolation Host, so he requested that the next time the problem happened that both spooler and PrintIsolationHost dumps would be gathered. The customer had configured his server for the “Isolated” Print Isolation Host option during troubleshooting, which places each driver in its own process. (The default is shared which places all drivers in one PrintIsolationHost.exe instance. Driver isolation is configured using the Print Management Console.)
The next morning, the newly requested data came in, and since the problem was urgent, I began looking at the new dumps immediately. This dataset included both a spoolsv.exe dump, as well as nearly two dozen PrintIsolationHost dumps! I knew from the past analysis that I should start with the PrintIsolationHost data – but where to begin? In order to triage the dumps, I wrote a small batch file to open each dump (luckily, they were sequentially numbered), write the call stacks in each thread to a file, and close the log. On every iteration, the script created a new cmd.txt file, which contained a set of commands that were passed to the debugger. This allowed me to name the debugger output files sequentially with names that matched their dump (e.g. PrintIsolationHost1.txt contained output from PrintIsolationHost1.dmp).
set x=1
:Top
echo .reload > c:\data\cmd.txt
echo .logopen c:\data\PrintIsolationHost%x%.txt  >> c:\data\cmd.txt
echo ~*kc >> c:\data\cmd.txt
echo .logclose >> c:\data\cmd.txt
echo qq >> c:\data\cmd.txt
c:\debuggers\kd.exe -cf c:\data\cmd.txt -z "c:\data\PrintIsolationHost%x%.DMP"
set /A x+=1
IF %x% LEQ 23 GOTO Top
Now that I had a directory full of text files, I used my favorite differencing tool to compare the stacks in each text file. I used the first PrintIsolationHost file as a reference. It only had four stacks, and these were common to all of the other files:
.  0  Id: 40c.1c28 Suspend: 0 Teb: 000007ff`fffde000 Unfrozen
Call Site
user32!ZwUserGetMessage
user32!GetMessageW
PrintIsolationHost!ATL::CAtlExeModuleT<Host>::Run
PrintIsolationHost!Host::RunUsingConfiguration
PrintIsolationHost!wWinMain
PrintIsolationHost!__wmainCRTStartup
kernel32!BaseThreadInitThunk
ntdll!RtlUserThreadStart

   1  Id: 40c.23c0 Suspend: 0 Teb: 000007ff`fffdb000 Unfrozen
Call Site
ntdll!ZwWaitForMultipleObjects
ntdll!TppWaiterpThread
kernel32!BaseThreadInitThunk
ntdll!RtlUserThreadStart

   2  Id: 40c.2598 Suspend: 0 Teb: 000007ff`fffd3000 Unfrozen
Call Site
ntdll!ZwWaitForSingleObject
KERNELBASE!WaitForSingleObjectEx
PrintIsolationHost!Host::MonitorShutdown
PrintIsolationHost!Host::MonitorProc
kernel32!BaseThreadInitThunk
ntdll!RtlUserThreadStart

   3  Id: 40c.820 Suspend: 0 Teb: 000007ff`fffd9000 Unfrozen
Call Site
ntdll!ZwWaitForWorkViaWorkerFactory
ntdll!TppWorkerThread
kernel32!BaseThreadInitThunk
ntdll!RtlUserThreadStart
I was able to rule out a number of other PrintIsolationHost instances that were either identical to this one (aside from the process/thread IDs and Tebs), or which just had one or two additional idle worker threads (like thread 3 above).
Things got interesting when I looked at two of the PrintIsolationHost dumps. Both had these two stacks not found in any other the other dumps (note that I do not have symbols for the 3rd-party print processor ProseWarePrintProcessor):
2 Id: 20a4.1328 Suspend: 0 Teb: 000007ff`fffda000 Unfrozen
Call Site
ntdll!ZwWaitForSingleObject
ntdll!RtlpWaitOnCriticalSection
ntdll!RtlEnterCriticalSection
ntdll!LdrLockLoaderLock
*** ERROR: Symbol file could not be found. Defaulted to export symbols for ProseWarePrintProcessor.dll -
KERNELBASE!GetModuleFileNameW
ProseWarePrintProcessor
ProseWarePrintProcessor
ProseWarePrintProcessor!ControlPrintProcessor
PrintIsolationProxy!sandbox::PrintProcessor::ControlPrintProcessor
rpcrt4!Invoke
rpcrt4!Ndr64StubWorker
rpcrt4!NdrStubCall3
ole32!CStdStubBuffer_Invoke
ole32!SyncStubInvoke
ole32!StubInvoke
ole32!CCtxComChnl::ContextInvoke
ole32!AppInvoke
ole32!ComInvokeWithLockAndIPID
ole32!ThreadInvoke
rpcrt4!DispatchToStubInCNoAvrf
rpcrt4!RPC_INTERFACE::DispatchToStubWorker
rpcrt4!RPC_INTERFACE::DispatchToStub
rpcrt4!RPC_INTERFACE::DispatchToStubWithObject
rpcrt4!LRPC_SCALL::DispatchRequest
rpcrt4!LRPC_SCALL::HandleRequest
rpcrt4!LRPC_ADDRESS::ProcessIO
rpcrt4!LrpcIoComplete
ntdll!TppAlpcpExecuteCallback
ntdll!TppWorkerThread
kernel32!BaseThreadInitThunk
ntdll!RtlUserThreadStart
6 Id: 20a4.1668 Suspend: 0 Teb: 000007ff`fffac000 Unfrozen
Call Site
ntdll!ZwWaitForSingleObject
ntdll!RtlpWaitOnCriticalSection
ntdll!RtlEnterCriticalSection
ProseWarePrintProcessor
ProseWarePrintProcessor
ProseWarePrintProcessor
ntdll!LdrpInitializeThread
ntdll!_LdrpInitialize
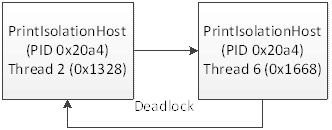
ntdll!LdrInitializeThunkInteresting. Thread 6 is running the DllMain code for the ProseWarePrintProcessor DLL which holds the loader lock. It is waiting on a critical section. Meanwhile, thread 2 is waiting on the loader lock. So who holds the critical section that thread 6 wants? First, let’s find what lock thread 6 wants:
0:006> kn
 # Child-SP          RetAddr           Call Site
00 00000000`0104eb18 00000000`777fe4e8 ntdll!ZwWaitForSingleObject+0xa
01 00000000`0104eb20 00000000`777fe3db ntdll!RtlpWaitOnCriticalSection+0xe8
02 00000000`0104ebd0 00000000`750c5d6b ntdll!RtlEnterCriticalSection+0xd1
03 00000000`0104ec00 00000000`750c6256 ProseWarePrintProcessor+0xabf
04 00000000`0104ec30 00000000`750c7015 ProseWarePrintProcessor+0xfaa
05 00000000`0104f090 00000000`777dc76c ProseWarePrintProcessor+0x1d69
06 00000000`0104f1f0 00000000`777dc42f ntdll!LdrpInitializeThread+0x17c
07 00000000`0104f2f0 00000000`777dc32e ntdll!LdrpInitialize+0x9f
08 00000000`0104f360 00000000`00000000 ntdll!LdrInitializeThunk+0xe
0:006> .frame /c /r 2
02 00000000`0104ebd0 00000000`750c5d6b ntdll!RtlEnterCriticalSection+0xd1
rax=0000000300d1001a rbx=00000000750ca330 rcx=00000000001d0000
rdx=0000000000000040 rsi=0000000000000001 rdi=0000000000000004
rip=00000000777fe3db rsp=000000000104ebd0 rbp=00000000ff000000
 r8=00000000002c6a00  r9=00000000002c6a10 r10=0000000000000073
r11=0000000000000001 r12=000007fffffd6000 r13=00000000778e2660
r14=0000000000000001 r15=000000007780a280
iopl=0         nv up ei pl zr na po nc
cs=0033  ss=002b  ds=002b  es=002b  fs=0053  gs=002b             efl=00000246
ntdll!RtlEnterCriticalSection+0xd1:
00000000`777fe3db 83f801          cmp     eax,1
0:006> ub 00000000`750c5d6b      <----------- Let's see what gets passed to RtlEnterCriticalSection
ProseWarePrintProcessor+0xaa2:
00000000`750c5d4e f9              stc
00000000`750c5d4f ff743f33        push    qword ptr [rdi+rdi+33h]
00000000`750c5d53 d2ff            sar     bh,cl
00000000`750c5d55 15aeb4ffff      adc     eax,0FFFFB4AEh
00000000`750c5d5a 85c0            test    eax,eax
00000000`750c5d5c 7533            jne     ProseWarePrintProcessor+0xae5 (00000000`750c5d91)
00000000`750c5d5e 488d0dcb450000  lea     rcx,[ProseWarePrintProcessor+0x5084 (00000000`750ca330)] <----- Critical section is in rcx
00000000`750c5d65 ff15bdb3ffff    call    qword ptr [ProseWarePrintProcessor+0x1128 (00000000`750c1128)]
0:006> u ntdll!RtlEnterCriticalSection
ntdll!RtlEnterCriticalSection:
00000000`77802fc0 fff3            push    rbx
00000000`77802fc2 4883ec20        sub     rsp,20h
00000000`77802fc6 f00fba710800    lock btr dword ptr [rcx+8],0
00000000`77802fcc 488bd9          mov     rbx,rcx   <------------------ Critical section is saved in RBX.  RBX isn't modified between here and our current position
00000000`77802fcf 0f83e9b1ffff    jae     ntdll!RtlEnterCriticalSection+0x31 (00000000`777fe1be)
00000000`77802fd5 65488b042530000000 mov   rax,qword ptr gs:[30h]
00000000`77802fde 488b4848        mov     rcx,qword ptr [rax+48h]
00000000`77802fe2 c7430c01000000  mov     dword ptr [rbx+0Ch],1
0:006> r rbx
Last set context:
rbx=00000000750ca330  <----- This is the address of the critical section thread 6 is waiting for
Now let’s look at the threads in this process, and the held locks:
0:002> ~
#  0  Id: 20a4.180c Suspend: 0 Teb: 000007ff`fffde000 Unfrozen
   1  Id: 20a4.2294 Suspend: 0 Teb: 000007ff`fffdc000 Unfrozen
.  2  Id: 20a4.1328 Suspend: 0 Teb: 000007ff`fffda000 Unfrozen
   3  Id: 20a4.1c34 Suspend: 0 Teb: 000007ff`fffd8000 Unfrozen
   4  Id: 20a4.5bc Suspend: 0 Teb: 000007ff`fffd4000 Unfrozen
   5  Id: 20a4.3c4 Suspend: 0 Teb: 000007ff`fffae000 Unfrozen
   6  Id: 20a4.1668 Suspend: 0 Teb: 000007ff`fffac000 Unfrozen
0:002> !locks

CritSec ntdll!LdrpLoaderLock+0 at 00000000778e7490
WaiterWoken        No
LockCount          2
RecursionCount     1
OwningThread       1668
EntryCount         0
ContentionCount    2
*** Locked

CritSec ProseWarePrintProcessor+5084 at 00000000750ca330
WaiterWoken        No
LockCount          1
RecursionCount     2
OwningThread       1328
EntryCount         0
ContentionCount    1
*** Locked

Scanned 201 critical sections
That’s not good! We can see that thread 6 indeed owns the loader lock, which thread 2 is waiting for. But thread 2 owns the ProseWarePrintProcessor lock – and thread 6 is waiting for it! This is a classic deadlock. In fact, Raymond Chen even described this on his blog. More information about LdrInitialize can be found here.
So we know that there is a deadlock in the Print Isolation Host, but why exactly does this cause spooler to hang? Here’s where we work backwards. We know that thread 6 is handling DLL initialization, but what is thread 2 doing? From the stack we can see it is handling an RPC request that called into ProseWarePrintProcessor. Let’s determine who called into this thread.
0:002> kn
 # Child-SP          RetAddr           Call Site
00 00000000`0085dd88 00000000`777fe4e8 ntdll!ZwWaitForSingleObject+0xa
01 00000000`0085dd90 00000000`777fe3db ntdll!RtlpWaitOnCriticalSection+0xe8
02 00000000`0085de40 00000000`777db9e7 ntdll!RtlEnterCriticalSection+0xd1
03 00000000`0085de70 000007fe`fd963706 ntdll!LdrLockLoaderLock+0x6d
04 00000000`0085deb0 00000000`750c58f3 KERNELBASE!GetModuleFileNameW+0x96
05 00000000`0085df10 00000000`750c5d77 ProseWarePrintProcessor!InstallPrintProcessor+0x647
06 00000000`0085e380 00000000`750c51d9 ProseWarePrintProcessor!InstallPrintProcessor+0xacb
07 00000000`0085e3b0 000007fe`f96766b4 ProseWarePrintProcessor!ControlPrintProcessor+0x25
08 00000000`0085e3e0 000007fe`fe2f23d5 PrintIsolationProxy!sandbox::PrintProcessor::ControlPrintProcessor+0x34
09 00000000`0085e420 000007fe`fe39b68e rpcrt4!Invoke+0x65
0a 00000000`0085e470 000007fe`fe2f48d6 rpcrt4!Ndr64StubWorker+0x61b
0b 00000000`0085ea30 000007fe`fdd50883 rpcrt4!NdrStubCall3+0xb5
0c 00000000`0085ea90 000007fe`fdd50ccd ole32!CStdStubBuffer_Invoke+0x5b
0d 00000000`0085eac0 000007fe`fdd50c43 ole32!SyncStubInvoke+0x5d
0e 00000000`0085eb30 000007fe`fdc0a4f0 ole32!StubInvoke+0xdb
0f 00000000`0085ebe0 000007fe`fdd514d6 ole32!CCtxComChnl::ContextInvoke+0x190
10 00000000`0085ed70 000007fe`fdd5122b ole32!AppInvoke+0xc2
11 00000000`0085ede0 000007fe`fdd4fd6d ole32!ComInvokeWithLockAndIPID+0x52b
12 00000000`0085ef70 000007fe`fe2e50f4 ole32!ThreadInvoke+0x30d
13 00000000`0085f010 000007fe`fe2e4f56 rpcrt4!DispatchToStubInCNoAvrf+0x14
14 00000000`0085f040 000007fe`fe2e775b rpcrt4!RPC_INTERFACE::DispatchToStubWorker+0x146
15 00000000`0085f160 000007fe`fe2e769b rpcrt4!RPC_INTERFACE::DispatchToStub+0x9b
16 00000000`0085f1a0 000007fe`fe2e7632 rpcrt4!RPC_INTERFACE::DispatchToStubWithObject+0x5b
17 00000000`0085f220 000007fe`fe2e532d rpcrt4!LRPC_SCALL::DispatchRequest+0x422
18 00000000`0085f300 000007fe`fe302e7f rpcrt4!LRPC_SCALL::HandleRequest+0x20d
19 00000000`0085f430 000007fe`fe302a35 rpcrt4!LRPC_ADDRESS::ProcessIO+0x3bf
1a 00000000`0085f570 00000000`777cb68b rpcrt4!LrpcIoComplete+0xa5
1b 00000000`0085f600 00000000`777cfeff ntdll!TppAlpcpExecuteCallback+0x26b
1c 00000000`0085f690 00000000`776a652d ntdll!TppWorkerThread+0x3f8
1d 00000000`0085f990 00000000`777dc521 kernel32!BaseThreadInitThunk+0xd
1e 00000000`0085f9c0 00000000`00000000 ntdll!RtlUserThreadStart+0x1d
I know that the code in frame 19 deals with processing the RPC and has a record of the calling process’ PID and TID. In fact, from a bit of code review, I know that at this portion of the code, we get back a value that contains a ntdll!_CLIENT_ID structure at offset 8:
rpcrt4!LRPC_ADDRESS::ProcessIO+0xe6:
000007fe`fe302ba6 ff151c050a00    call    qword ptr [rpcrt4!_imp_AlpcGetMessageFromCompletionList (000007fe`fe3a30c8)]
000007fe`fe302bac 4885c0          test    rax,rax
000007fe`fe302baf 0f84d1020000    je      rpcrt4!LRPC_ADDRESS::ProcessIO+0x3c6 (000007fe`fe302e86)
000007fe`fe302bb5 4c8bac2488000000 mov     r13,qword ptr [rsp+88h]
000007fe`fe302bbd 41bc01000000    mov     r12d,1
000007fe`fe302bc3 33d2            xor     edx,edx
000007fe`fe302bc5 488bf8          mov     rdi,rax
000007fe`fe302bc8 41bfff000000    mov     r15d,0FFh
Reviewing the assembly, from ProcessIO+0xe6 to where we are now (ProcessIO+0x3bf), we don’t modify rdi again – and rdi is nonvolatile – so if we switch to that frame and check out rdi+8, we’ll know who called this thread!
0:002> .frame /c /r 19
19 00000000`0085f430 000007fe`fe302a35 rpcrt4!LRPC_ADDRESS::ProcessIO+0x3bf
rax=0000e5a47e7646ad rbx=0000000000000001 rcx=00000000750ca330
rdx=0000000000000000 rsi=00000000002b8aa0 rdi=00000000002c4a80
rip=000007fefe302e7f rsp=000000000085f430 rbp=0000000000ecff90
 r8=000000000085e2d8  r9=0000000000000002 r10=0000000000000000
r11=0000000000000246 r12=0000000000ec8bf0 r13=0000000000000000
r14=0000000000000000 r15=0000000000ec8080
iopl=0         nv up ei pl zr na po nc
cs=0033  ss=002b  ds=002b  es=002b  fs=0053  gs=002b             efl=00000246
rpcrt4!LRPC_ADDRESS::ProcessIO+0x3bf:
000007fe`fe302e7f 4c8d357ad1fbff  lea     r14,[rpcrt4!COMMON_ResubmitListen <PERF> (rpcrt4+0x0) (000007fe`fe2c0000)]
0:002> dt _CLIENT_ID rdi+8
ntdll!_CLIENT_ID
   +0x000 UniqueProcess    : 0x00000000`00002694 Void
   +0x008 UniqueThread     : 0x00000000`000005e8 Void
0:002> ? 0x00000000`00002694
Evaluate expression: 9876 = 00000000`00002694
0:002> ? 0x00000000`000005e8
Evaluate expression: 1512 = 00000000`000005e8
So now we know that the caller was process 0x2694 and thread 0x5e8, or 9876 and 1512 in decimal, respectively. Our current process (PrintIsolationHost.exe) is PID 20a4 (see above ~ output), or 8356 decimal. So who is 9876? I happen to have a Process Listing from the dump of the data collection:
[0]  0 64 9876 spoolsv.exe     Svcs:  Spooler
     Command Line: C:\Windows\System32\spoolsv.exe
[0]  0 64 8356 PrintIsolationHost.exe
     Command Line: C:\Windows\system32\PrintIsolationHost.exe -Embedding
Okay, so I know the caller is thread 5e8 in spooler. Loading up the spooler dump, what is that thread doing?
0:000> ~~[5e8]s
ntdll!NtAlpcSendWaitReceivePort+0xa:
00000000`77801b6a c3              ret
# Child-SP          RetAddr           Call Site
00 00000000`0649d898 000007fe`fe2fa776 ntdll!NtAlpcSendWaitReceivePort+0xa
01 00000000`0649d8a0 000007fe`fe2f4e42 rpcrt4!LRPC_CCALL::SendReceive+0x156
02 00000000`0649d960 000007fe`fdd528c0 rpcrt4!I_RpcSendReceive+0x42
03 00000000`0649d990 000007fe`fdd5282f ole32!ThreadSendReceive+0x40
04 00000000`0649d9e0 000007fe`fdd5265b ole32!CRpcChannelBuffer::SwitchAptAndDispatchCall+0xa3
05 00000000`0649da80 000007fe`fdc0daaa ole32!CRpcChannelBuffer::SendReceive2+0x11b
06 00000000`0649dc40 000007fe`fdc0da0c ole32!CAptRpcChnl::SendReceive+0x52
07 00000000`0649dd10 000007fe`fdd5205d ole32!CCtxComChnl::SendReceive+0x68
08 00000000`0649ddc0 000007fe`fe39b949 ole32!NdrExtpProxySendReceive+0x45
09 00000000`0649ddf0 000007fe`fdd521d0 rpcrt4!NdrpClientCall3+0x2e2
0a 00000000`0649e0b0 000007fe`fdc0d8a2 ole32!ObjectStublessClient+0x11d
0b 00000000`0649e440 000007fe`fb059070 ole32!ObjectStubless+0x42
0c 00000000`0649e490 000007fe`fb057967 localspl!sandbox::PrintProcessorExecuteObserver::ControlPrintProcessor+0x10
0d 00000000`0649e4c0 000007fe`fb055e27 localspl!sandbox::PrintProcessorAdapterImpl::ControlPrintProcessor+0x27
0e 00000000`0649e4f0 000007fe`faff7392 localspl!sandbox::PrintProcessorAdapter::ControlPrintProcessor+0x1b
0f 00000000`0649e520 000007fe`faff8a0a localspl!DeleteJob+0x1ce
10 00000000`0649eae0 00000000`ff41fe25 localspl!SplSetJob+0x49e
11 00000000`0649eb80 000007fe`f9683603 spoolsv!SetJobW+0x25
12 00000000`0649ebc0 00000000`61001ce1 spoolss!SetJobW+0x1f
13 00000000`0649ec00 00000000`61001d7d Contoso!InitializePrintMonitor+0x781
14 00000000`0649ec40 000007fe`faffa674 Contoso!InitializePrintMonitor+0x81d
15 00000000`0649ec70 00000000`ff41c9c7 localspl!SplEndDocPrinter+0x214
16 00000000`0649ecd0 00000000`ff403ba6 spoolsv!EndDocPrinter+0x1f
17 00000000`0649ed00 00000000`ff3fe772 spoolsv!YEndDocPrinter+0x22
18 00000000`0649ed30 000007fe`fe2f23d5 spoolsv!RpcEndDocPrinter+0x3e
19 00000000`0649ed60 000007fe`fe39b68e rpcrt4!Invoke+0x65
1a 00000000`0649edb0 000007fe`fe2dac40 rpcrt4!Ndr64StubWorker+0x61b
1b 00000000`0649f370 000007fe`fe2e50f4 rpcrt4!NdrServerCallAll+0x40
1c 00000000`0649f3c0 000007fe`fe2e4f56 rpcrt4!DispatchToStubInCNoAvrf+0x14
1d 00000000`0649f3f0 000007fe`fe2e5679 rpcrt4!RPC_INTERFACE::DispatchToStubWorker+0x146
1e 00000000`0649f510 000007fe`fe2e532d rpcrt4!LRPC_SCALL::DispatchRequest+0x149
1f 00000000`0649f5f0 000007fe`fe302e7f rpcrt4!LRPC_SCALL::HandleRequest+0x20d
20 00000000`0649f720 000007fe`fe302a35 rpcrt4!LRPC_ADDRESS::ProcessIO+0x3bf
21 00000000`0649f860 00000000`777cb68b rpcrt4!LrpcIoComplete+0xa5
22 00000000`0649f8f0 00000000`777cfeff ntdll!TppAlpcpExecuteCallback+0x26b
23 00000000`0649f980 00000000`776a652d ntdll!TppWorkerThread+0x3f8
24 00000000`0649fc80 00000000`777dc521 kernel32!BaseThreadInitThunk+0xd
25 00000000`0649fcb0 00000000`00000000 ntdll!RtlUserThreadStart+0x1d
It’s calling into the print isolation host as we expect. It looks like it is doing that to end a print job, based on an RPC call it received. Using our same method as last time, let’s pull out the PID and TID he is responding to:
0:048> .frame /c /r 20
20 00000000`0649f720 000007fe`fe302a35 rpcrt4!LRPC_ADDRESS::ProcessIO+0x3bf
rax=000000000622986c rbx=0000000000000000 rcx=000000000622985c
rdx=000007fefe3a3c40 rsi=00000000027e5150 rdi=0000000008e6abd0
rip=000007fefe302e7f rsp=000000000649f720 rbp=0000000008e43480
 r8=0000000000000010  r9=0000000000000000 r10=000007fefe2c0000
r11=0000000000000002 r12=000000000512d8c0 r13=0000000000000000
r14=0000000000000000 r15=00000000102e3710
iopl=0         nv up ei pl zr na po nc
cs=0033  ss=002b  ds=002b  es=002b  fs=0053  gs=002b             efl=00000246
rpcrt4!LRPC_ADDRESS::ProcessIO+0x3bf:
000007fe`fe302e7f 4c8d357ad1fbff  lea     r14,[rpcrt4!COMMON_ResubmitListen <PERF> (rpcrt4+0x0) (000007fe`fe2c0000)]
0:048> dt _CLIENT_ID rdi+8
ntdll!_CLIENT_ID
   +0x000 UniqueProcess    : 0x00000000`000020a4 Void
   +0x008 UniqueThread     : 0x00000000`00001c34 Void
Look at that, it’s doing work for a different thread back in our Print Isolation Host. Switching back to that dump, what is thread 1c34 doing?
0:002> ~~[1c34]s
ntdll!NtAlpcSendWaitReceivePort+0xa:
00000000`77801b6a c3
0:003> kn
# Child-SP RetAddr Call Site
00 00000000`00ebc098 000007fe`fe2fa776 ntdll!NtAlpcSendWaitReceivePort+0xa
01 00000000`00ebc0a0 000007fe`fe39cc74 rpcrt4!LRPC_CCALL::SendReceive+0x156
02 00000000`00ebc160 000007fe`fe39cf25 rpcrt4!NdrpClientCall3+0x244
03 00000000`00ebc420 000007fe`f9bfd878 rpcrt4!NdrClientCall3+0xf2
04 00000000`00ebc7b0 000007fe`f96845bf winspool!EndDocPrinter+0x15c
05 00000000`00ebc7f0 00000000`750c4102 spoolss!EndDocPrinter+0x2f
06 00000000`00ebc820 00000000`750c5013 ProseWarePrintProcessor+0x4102
07 00000000`00ebe620 000007fe`f9676be2 ProseWarePrintProcessor!PrintDocumentOnPrintProcessor+0xb3
08 00000000`00ebe650 000007fe`fe2f23d5 PrintIsolationProxy!sandbox::PrintProcessor::PrintDocThroughPrintProcessor+0x82
09 00000000`00ebe6b0 000007fe`fe39b68e rpcrt4!Invoke+0x65
0a 00000000`00ebe710 000007fe`fe2f48d6 rpcrt4!Ndr64StubWorker+0x61b
0b 00000000`00ebecd0 000007fe`fdd50883 rpcrt4!NdrStubCall3+0xb5
0c 00000000`00ebed30 000007fe`fdd50ccd ole32!CStdStubBuffer_Invoke+0x5b
0d 00000000`00ebed60 000007fe`fdd50c43 ole32!SyncStubInvoke+0x5d
0e 00000000`00ebedd0 000007fe`fdc0a4f0 ole32!StubInvoke+0xdb
0f 00000000`00ebee80 000007fe`fdd514d6 ole32!CCtxComChnl::ContextInvoke+0x190
10 00000000`00ebf010 000007fe`fdd5122b ole32!AppInvoke+0xc2
11 00000000`00ebf080 000007fe`fdd4fd6d ole32!ComInvokeWithLockAndIPID+0x52b
12 00000000`00ebf210 000007fe`fe2e50f4 ole32!ThreadInvoke+0x30d
13 00000000`00ebf2b0 000007fe`fe2e4f56 rpcrt4!DispatchToStubInCNoAvrf+0x14
14 00000000`00ebf2e0 000007fe`fe2e775b rpcrt4!RPC_INTERFACE::DispatchToStubWorker+0x146
15 00000000`00ebf400 000007fe`fe2e769b rpcrt4!RPC_INTERFACE::DispatchToStub+0x9b
16 00000000`00ebf440 000007fe`fe2e7632 rpcrt4!RPC_INTERFACE::DispatchToStubWithObject+0x5b
17 00000000`00ebf4c0 000007fe`fe2e532d rpcrt4!LRPC_SCALL::DispatchRequest+0x422
18 00000000`00ebf5a0 000007fe`fe302e7f rpcrt4!LRPC_SCALL::HandleRequest+0x20d
19 00000000`00ebf6d0 000007fe`fe302a35 rpcrt4!LRPC_ADDRESS::ProcessIO+0x3bf
1a 00000000`00ebf810 00000000`777cb68b rpcrt4!LrpcIoComplete+0xa5
1b 00000000`00ebf8a0 00000000`777cfeff ntdll!TppAlpcpExecuteCallback+0x26b
1c 00000000`00ebf930 00000000`776a652d ntdll!TppWorkerThread+0x3f8
1d 00000000`00ebfc30 00000000`777dc521 kernel32!BaseThreadInitThunk+0xd
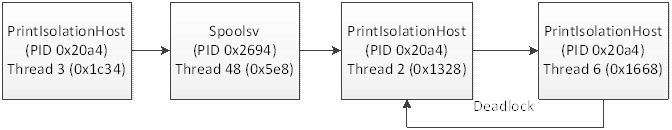
1e 00000000`00ebfc60 00000000`00000000 ntdll!RtlUserThreadStart+0x1dThis thread called into spooler to end a document based on yet another RPC! To be clear, this is what we’re looking at so far:
Again, who called into this thread?
0:003> .frame /c /r 19
19 00000000`00ebf6d0 000007fe`fe302a35 rpcrt4!LRPC_ADDRESS::ProcessIO+0x3bf
rax=57633d3cd2c9c145 rbx=0000000000000000 rcx=0000000000861ff0
rdx=ffffffffff88ffe0 rsi=00000000002b8aa0 rdi=0000000000ec6bc0
rip=000007fefe302e7f rsp=0000000000ebf6d0 rbp=00000000002cdef0
 r8=000000000003dbf0  r9=00000000000000fe r10=6dc0575d3d3cc4c8
r11=0000000000860020 r12=0000000000ec82b0 r13=0000000000000000
r14=0000000000000000 r15=0000000000ec8080
iopl=0         nv up ei pl zr na po nc
cs=0033  ss=002b  ds=002b  es=002b  fs=0053  gs=002b             efl=00000246
rpcrt4!LRPC_ADDRESS::ProcessIO+0x3bf:
000007fe`fe302e7f 4c8d357ad1fbff  lea     r14,[rpcrt4!COMMON_ResubmitListen <PERF> (rpcrt4+0x0) (000007fe`fe2c0000)]
0:003> dt _CLIENT_ID rdi+8
ntdll!_CLIENT_ID
   +0x000 UniqueProcess    : 0x00000000`00002694 Void
   +0x008 UniqueThread     : 0x00000000`000014cc Void
So another call from spooler (note the same PID as earlier) – let’s go back to spoolsv.dmp. Here is this thread:
0:048> ~~[14cc]s
ntdll!NtAlpcSendWaitReceivePort+0xa:
00000000`77801b6a c3              ret
0:049> k
Child-SP          RetAddr           Call Site
00000000`0351e538 000007fe`fe2fa776 ntdll!NtAlpcSendWaitReceivePort+0xa
00000000`0351e540 000007fe`fe2f4e42 rpcrt4!LRPC_CCALL::SendReceive+0x156
00000000`0351e600 000007fe`fdd528c0 rpcrt4!I_RpcSendReceive+0x42
00000000`0351e630 000007fe`fdd5282f ole32!ThreadSendReceive+0x40
00000000`0351e680 000007fe`fdd5265b ole32!CRpcChannelBuffer::SwitchAptAndDispatchCall+0xa3
00000000`0351e720 000007fe`fdc0daaa ole32!CRpcChannelBuffer::SendReceive2+0x11b
00000000`0351e8e0 000007fe`fdc0da0c ole32!CAptRpcChnl::SendReceive+0x52
00000000`0351e9b0 000007fe`fdd5205d ole32!CCtxComChnl::SendReceive+0x68
00000000`0351ea60 000007fe`fe39b949 ole32!NdrExtpProxySendReceive+0x45
00000000`0351ea90 000007fe`fdd521d0 rpcrt4!NdrpClientCall3+0x2e2
00000000`0351ed50 000007fe`fdc0d8a2 ole32!ObjectStublessClient+0x11d
00000000`0351f0e0 000007fe`fb0591ac ole32!ObjectStubless+0x42
00000000`0351f130 000007fe`fb057882 localspl!sandbox::PrintProcessorExecuteObserver::PrintDocThroughPrintProcessor+0x124
00000000`0351f1f0 000007fe`fb05601d localspl!sandbox::PrintProcessorAdapterImpl::PrintDocumentOnPrintProcessor+0x3a
00000000`0351f220 000007fe`fb013b70 localspl!sandbox::PrintProcessorAdapter::PrintDocumentOnPrintProcessor+0x9d
00000000`0351f270 000007fe`fb014c7c localspl!PrintDocumentThruPrintProcessor+0x46c
00000000`0351fa70 00000000`776a652d localspl!PortThread+0x4d0
00000000`0351fd80 00000000`777dc521 kernel32!BaseThreadInitThunk+0xd
00000000`0351fdb0 00000000`00000000 ntdll!RtlUserThreadStart+0x1d
Perfect. So now we know that localspl was printing a document, which resulted in all of these RPC calls between spooler and Print Isolation Host, and ultimately the deadlock in Print Isolation Host is holding up this thread. Just out of curiosity, are there any other threads blocked on this wait chain?
0:049> !locks
CritSec +5a00060 at 0000000005a00060
WaiterWoken        No
LockCount          105
RecursionCount     1
OwningThread       5e8
EntryCount         0
ContentionCount    84
*** Locked

Scanned 14148 critical sections
Yes there are. Thread 5e8, which we looked at earlier, is holding a lock that 104 other threads are waiting for! This dump had 177 threads, so we know now that thread 5e8, 14cc, and 104 others in spooler are all hung on this deadlock. With about 60% of all the threads in spooler hung, the deadlock in ProseWarePrintProcessor is clearly the cause of our issue. Here’s the final wait chain diagram:
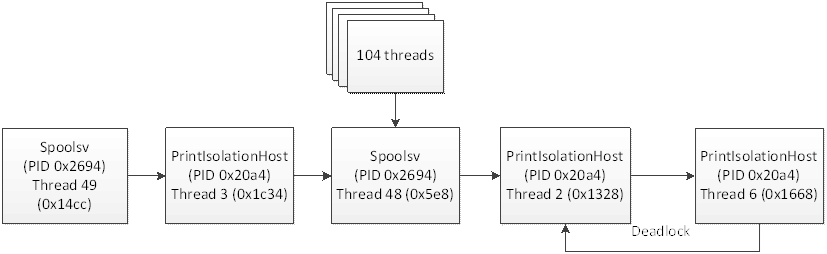
To resolve the issue, ProseWarePrintProcessor needs to avoid calling GetModuleFileName while its DllMain routine is still running, since the former requires, and the latter holds, the Loader Lock.